Magnetic and 3D Resistivity Imagings for Locating Kilns in Mae Taeng, Chiang Mai
Abstract
Intakhin kiln site in Intakhin Subdistrict, Mae Taeng District, Chiang Mai Province is one of the important archaeological sites in Thailand. This study aimed to use gradient magnetic and 3D resistivity imaging techniques to help locate the kilns in the Intakhin area. The preliminary study employed both geophysical surveying techniques for data acquisition over an area of 5 × 20 m 2 . The magnetic gradient data were acquired using
WCZ-2 Proton Magnetometer with two sensors. The magnetic data were measured at every 1×1 m spaced grid. The magnetic data were enhanced by analytic signal and 2 nd derivative data processing techniques. The resulting magnetic maps present an area of high magnetic gradient values that may indicate a kiln location. The 3D resistivity imaging data were acquired using
WGMD-9 Multi-electrode 2D/3D Resistivity/IP Imaging System with 3D dipole - dipole array of 1 m electrode spacing and 1 m line spacing. 3D least-square inversion based on a smoothness-constrained technique was applied to the resistivity data set. 3D visualization technique revealeds a high resistivity zone at depths from 0.5 to 2.0 m corresponding to the kiln location interpreted from the magnetic maps. Combined usage of the magnetic and 3D resistivity imaging techniques is a powerful tool to help mapping kiln locations. Thus the techniques can be applied for further location of kilns in the study area.
Keywords Kiln, Archaeological Investigation, Geophysical Technique, Magnetic Survey, 3D resistivity imaging
Introduction
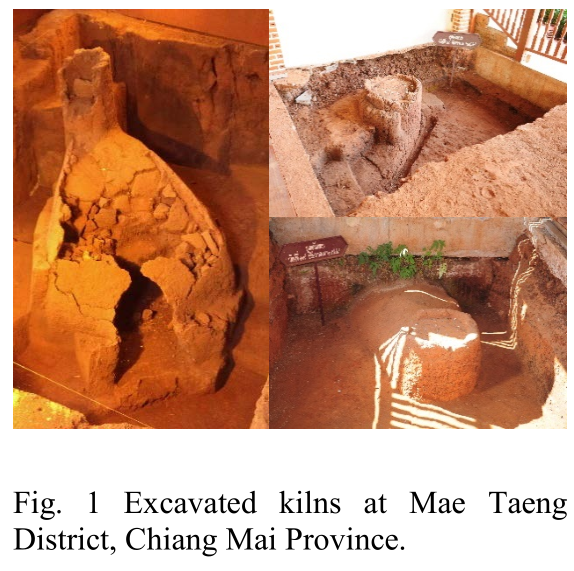
Intakhin kiln site is reognized as one of the most important archaeological and historical resources of Thailand. There are at least 13 known ancient ceramic kiln sites (Prishanchit and Duangsakul, 1997). The most recently discovered and excavated kiln site is at Baan San Patong, Intakhin Subdistrict, Mae Taeng District, Chiang Mai Province. The kilns have been found in the subsoil at a depth of about 1.0 m (Fig.1). The kiln shape viewing from top is similar to a laid-jar with mouth-rim down to the earth at low level and its narrow foot-rim raised-up.
This study proposeds the use of geophysical imaging techniques, gradient magnetic and 3D resistivity to help locate undiscovered kilns in the Intakhin Subdistrict area. Even though the usage of geophysical methods on archaeological sites began as early as the late 1940s, the magnetic and resistivity methods of geophysics have been widely applied by many researchers only since the 1980s in order to obtain high-resolution images of unexcavated archaeological structures (Drahor, 2006). The magnetic method is very sensitive to the magnetic susceptibility changes within the soil. The archaeological structures that include the thermoremanent magnetization such as kiln, pottery deposits, etc., which are very common in archaeological sites, are important magnetic features. Magnetic scanning by a gradiometer, which is quite practicable, is a very important development to collect data quickly in archaeological prospection, and today, this technique is extensively used to obtain maximum information from a site for subsurface planning (Walker and Somers, 1994; Clark, 1996).
The resistivity technique is very popular in the investigation of archaeological sites for mapping buried antiquities. The success of the method depends on the different resistivity properties between the potential archaeological targets (walls, roads, buildings, graves, ditches, etc.) and the surrounding environment (Chamber, 2001).
Study Area
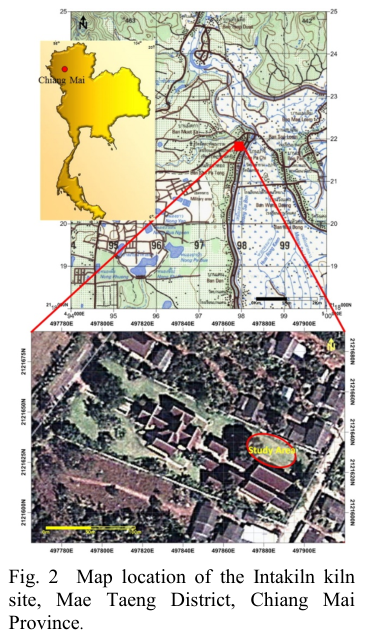
The preliminary study area was a 5 × 20 m 2 area located in the Intakhin kiln site, Intakhin Subdistrict, Mae Taeng District, Chiang Mai Province, Thailand. (Fig. 2).
Methodology
Magnetic mapping
Magnetic surveys were conducted using a
WCZ-2 Proton Magnetometer with 2 sensors 0.5 m to obtain vertical gradient and for resolving smaller archaeological features. The magnetic data were collected at every 1×1 m spaced grid. The magnetic data were firstly processed to remove noise spikes using de- spike before achieving a suitable filtering process. Afterwards the de-spiking was applied to remove ‘‘iron spikes’’ and similar disturbances from the gradiometer data. Then the data were enhanced by analytic signal, and 2 nd vertical derivative techniques to increase the data quality. The analytic signal was used to combine the vertical and horizontal derivatives. Shape of the analytic signal depends on a location of the bodies but not on direction of magnetization (Blakely,1995). Magnetic map produced from the analytic signal are used for interpretation differentiated from a complex potential to represent field intensity (Nabighian, 1972).
The 2 nd vertical derivative is an early mainstay of interpretation techniques because it helps to resolve and accentuate shallow sources (Milligan and Gun, 1997). The 2 nd vertical derivative of the magnetic field is the rate of change of the vertical gradient in the vertical direction (Milligan and Gun, 1997. The 2 nd vertical derivative is a measure of the curvature of the potential field: positive values indicate the increasing vertical gradient and negative
values indicate the decreasing vertical gradient of the potential field (Milligan and Gun, 1997.
3D Resistivity imaging
Resistivity imaging surveying was carried out using the
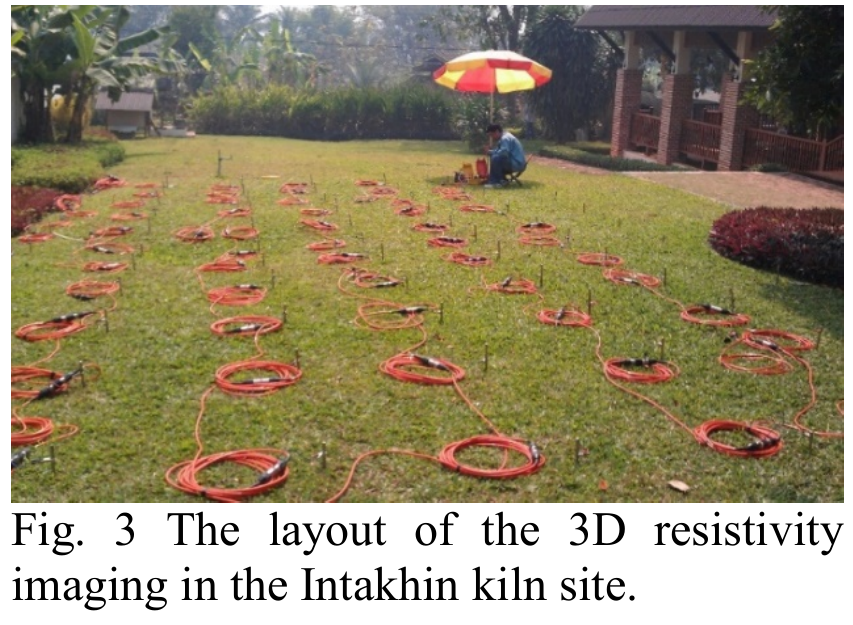
WGMD-9 Multi-electrode 2D/3D Resistivity/IP Imaging System . The typical setup for a 3D resistivity imaging consisted of electrodes attached to a multi-core cable. The resistivity measurements were performed using configuration with the 3D dipole - dipole array with a 1 m electrode spacing and 1 m distance between parallel line. (Fig. 3).
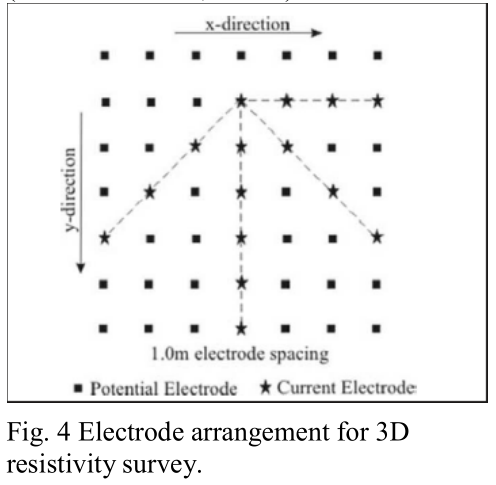
The electrodes were in turn used as current electrode and the potential at all electrodes along the x-axis, y-axis and 45° diagonals were measured (Fig 4). Because of reciprocity, the potentials at the electrodes with a higher index number than the current electrode were measured (Loke and Barker, 1996b).
The measured resistivity data were manually arranged in a compatible format to be used for data inversion and interpretation by the RES3DINV software (Geotomo, 2002).The 3D results can be considered as a reliable representation of the resistivity distribution of the subsurface. Selected horizontal/vertical slices can be extracted from the 3D resistivity volume. The 3D anomalous zones are easily displayed by selecting resistivity iso-surfaces. The resistivity values were used in order to highlight the resistivity variations.
Results
Magnetic result
The resultant magnetic maps from the study area at the Intakhin site are presented in Fig 5. The maps are shown in color- scale images in which the red tone represents high magnetic anomaly while the blue tone represents low magnetic anomaly.
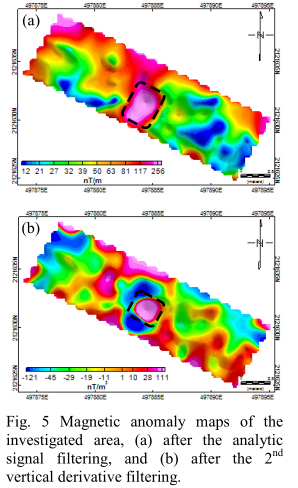
Traces of kiln structures present in an area of 2 x 3 m 2 in the magnetic images at high magnetic intensity range over 150nT/m (black rectangular, Fig.5a) and over 100 nT/m 2 (black rectangular, Fig.5b).
Resistivity result
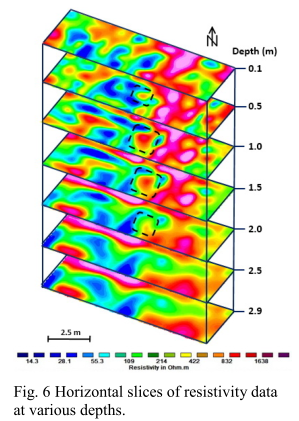
The horizontal slices extracted from the resistivity data volume (Fig. 6) display the lateral extent of high resistivity zones that may indicate a kiln location. The high resistivity anomaly zones with resistivity values are >800 ohm-m observed on the horizontal slices at depths ranging from 0.5 to 2.0 m are also related to the high magnetic anomaly zone on the magnetic anomaly maps in Fig. 5a and Fig. 5b.
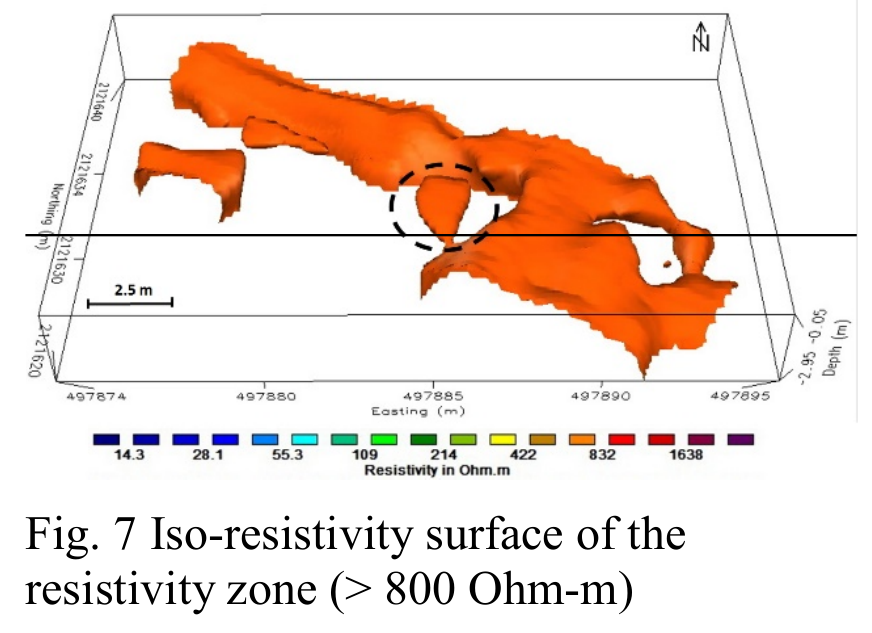
The boundary of the prospective kiln may be displayed by the 3D resistivity rendering (Fig.7). The resistivity values greater than 800 ohm-m can be extracted from the volume and the size and location of the kiln can be visualized.
Conclusions
The application of a magnetic gradiometer and 3D resistivity imaging methods helps in visualizing archaeological relics beneath the surface at the Intakhin kiln site. The depth, vertical extension, location, thickness, and electrical and magnetic properties of the structures together with their environs were revealed by the geophysical studies. Magnetic gradiometer studies showed that there were regular magnetic anomalies in the middle part of the area. The general outlines of the archaeological structures in this part were successfully traced. Resistivity investigations were also very successful in determining the main features of the archaeological remains. This result corroborated the magnetic imaging results, and verified the anomalies in magnetic gradient images. Combined usage of the magnetic and 3D resistivity imaging techniques is a powerful tool to help mapping kiln locations. Thus the techniques can be applied for further location of kilns in the study area.
 ENGLISH
 Chinese
 Russian

