Electrical Resistivity Imaging Method for Evaluate Estuarine Impace on Graoundwater Salinization in Pondicherry Coastal Aquifers of India
A B S T R A C T
Estuaries are zones of interaction and transition between groundwater and the sea where dissolved constituents like pollutants, nutrients, etc. can be diluted, exchanged, transformed and consumed. An attempt has been made in the estuarine regions of Pondicherry by a total of 6 geophysical resistivity 1D and 2D soundings to demarcate the sources of groundwater salinization. Locations in conformity to the estuaries were identified to be influenced by the estuarine water quality and the locations away from the estuaries are found to be influenced by other processes like saline water intrusion and litho types. Vertical electrical sounding demarcated a total of three layers with varying resistivity and found in conformity with electrical resistivity imaging. Litho logs confined to certain locations were used to identify the formation influenced by estuarine water quality and other processes. Hence, the influences of estuaries on the coastal groundwater were identified along with other process like saline water intrusion and litho types.
1. Introduction
Estuaries are of great importance to mankind. Estuaries are of immense significance for food sources and link of transport between river and sea (Hobbie 2000). Major estuaries are located mostly in cities or adjacent areas and act as a main source for transport development. Mixing of freshwater into the sea and vice versa creates a unique biodiversity and environmental portal, influenced by periodic tidal, evapo-transpiration fluctuations, irregular rainfall, regional groundwater flow and exchange between sea and river, substances and sediments (Nixon et al. 1986; Houde and Rutherford 1993). The areas of coastal environments represent zones of interaction and transition between groundwater and the sea where dissolved constituents like pollutants, nutrients, etc. can be diluted, exchanged, transformed and consumed (Caddy 1993). To identify major processes affecting solute exchange across transition zones it is critical to assess contaminant fluxes to the sediment/water interface. Groundwater/surface water interactions in estuarine environments are predisposed by a large number of processes forming complex spatially and temporally variable systems. Groundwater is also the sources for nutrient transport in coastal areas and the influence of human population within coastal watersheds has led to significant groundwater contamination (Glover 1959; Simpson et al. 2003). With 75% of the world’s population is expected to live within 35 miles of a coastline by 2020.
It is vitally important that we understand how anthropogenic contamination/seawater influences is transformed and attenuated in the environment as it is transported from land to the ocean. The salinity of groundwater is mainly due to dissolved mineral concentration in the water (Karanth 1987). Owing to the expansion of human, industrial and agricultural activities in coastal areas, the over-exploitation of the groundwater resources causes groundwater levels to fall coupled with land subsidence and deterioration in water quality (Robinson and Gallagher 1999). Consequently the hydrostatic balance between the groundwater and seawater interface can be broken, causing seawater intrusion into the aquifers (Reilly and Goodman 1985). Salinity in an estuary varies according to tides and volume of fresh water flowing into the estuary. In estuaries, salinity levels are generally highest near the mouth of a river where the ocean water enters, and lowest upstream where freshwater flows in. Pondicherry, a coastal area in south India, gifted with substantial water resources due to wide network of tanks and good rainfall. Nearly 80% of groundwater is utilized for agricultural purposes, resulting in drastic depletion of groundwater levels. In addition, many industries situated in the proposed study area are also a great threat to groundwater resources. River Sankaraparani, also known as Gingee or Varahanadhi originates in Alayanur hills of Villupuram district of South India and drains into the Bay of Bengal on the southern side of Pondicherry region. The River bifurcates into two namely Chunnambar in the south and Ariankuppam in the north. This river is not a perennial river and it flows only during rainy season and floods. Due to tremendous increase of population in this area, the generation of wastewater has also increased. The waste generated from nearby areas of Ariyankuppam and Chunnambar areas is let out into the river directly, deteriorating the water quality of the river. A proper evaluation of estuaries on the groundwater quality and factors affecting their characteristics in different aquifers is needed to ensure optimal utilization of groundwater and to suggest appropriate remedial measures. Hence, an attempt has been made in the coastal tracts of Pondicherry region to demarcate the influences of estuaries on the groundwater quality using electrical resistivity imaging techniques and VES.
In Geophysical methods, electrical resistivity is commonly used to study near-surface processes and deep-underground features (Srinivasamoorthy et al. 2012). A benefit of using electrical resistivity method to other geophysical methods is that resistivity values in Ωm are of much larger range than other physical quantities (Kalinski et al. 1993; Daniels and Alberty 1966). Measured resistivity variations are due to modifications in sediment composition, bed rock and pore fluids (Griffiths et al. 1990). Since the resistivity of majority of bed rocks and minerals are higher than subsurface fluid, the current applied flows mainly through pore fluids and the resistivity variation is due to the presence and quality of pore fluids (Srinivasamoorthy et al. 2009). For this reason, electrical measurements are used to determine the presence and quality of pore fluids and aquifer properties. In coastal regions tidal/backwater will result in different fluid density variations. Our study is focused to demarcate the discharge of backwater on costal groundwater using electrical resistivity imaging methods.
2. Study area
The proposed study area forms the coastal regions of the Pondicherry which is situated between 11°50ʹ and 11°57ʹ N latitudes and 79°45ʹ and 79°52ʹ E longitudes with a total area of 154.8 sq. km (Fig.1). It is bounded on the east by Bay of Bengal, on the north and west by Villupuram and on south by Cuddalore districts of Tamil Nadu state. In 2011, Pondicherry had population of 946,600. Three major physiographic units observed in the study area are: Coastal plain, Alluvial plain and Uplands. Soils identified in the area are Red soil of red sandy/clay loam type. Various The normal annual rainfall is 1205mm. The mean temperature ranges from 25°C to 33°C.
The geology of the area consists of unconsolidated and semi- consolidated formations lying on Archaean basement. The sedimentsare mainly clay, claystone, silt, siltstone, marl, limestone, sand, sandstone and gravel. All these sediments occur as alternating strata. The principal aquifers of the study area are unconsolidated quaternary alluvial deposits of recent period with a thickness ranging from 10 to 55m. The transmissivity of the aquifer ranges between 275 to 770m 2 /s, hydraulic conductivity amid 5 to 10m/day and specific yield among 6 to 15%. There are 59 tanks connected to the river system and 25 rain fed tanks, which irrigate the agricultural lands of Pondicherry (CGWB 1997). Agriculture is one of the main occupations of the people and paddy forms the major crop. Groundwater is the main source for drinking, irrigation and industrial needs. The observed water level in the recent alluvial aquifers ranges between 5 to 20m below round level (bgl). Declining trend of water level is noted on an average of 1 to 1.5m/year. This is because of the reason that the groundwater is the only sources of water for all purpose.
3. Methodology
3.1. Geoelectrical resistivity profiling High-resolution electrical surveys play an important role in data acquisition especially in noisy areas. This is achieved by over lapping data levels with different combinations of Wenner arrays. The number of data points produced by such high-resolution survey is more than twice that obtained with a conventional array in routine application and hence a better area coverage and resolution can be achieved. After analysis and processing of the measured data in the field, pseudo-depth sections are constructed (Dey and Morrison 1979 a ; Griffiths and Barker 1993) with over lapping data levels. By having such redundant measurements using the overlapping data levels, the effect of more noisy data-points will be reduced. Finally, Electrical Resistivity Imaging (ERI) surveys play a significant role for better data coverage so that the sub-surface architecture can be studied with reasonable precision and faster survey.
In this study multi electrodes (32 Nos.) were connected with the resistivity meter. Wenner - α configuration (Fig.2) has been deployed for this study. The ERI profiling was attempted at six locations,perpendicular to the coast with an electrode spacing of 5m, profile length of 150m with a depth of investigation as 27.6m. Usually, the apparent resistivity pseudo section produces a distorted image of the subsurface resistivity. Hence, inversion of the field observations is the standard procedure to obtain an estimate of the true resistivity distribution. A fast numerical approach is then used to optimize an initial multilayer model constructed directly from the observed apparent resistivity values (Loke 2004). A finite difference or finite element technique is usually used to calculate the 2D forward response of the model (Barker et al. 2001). By the subsequent iterations, the model is updated until an acceptable RMS misfit between the observed and model pseudo section is achieved. The resistivity obtained was inverted to create pseudo-section using RES2DINV software (Loke 1997).
3.2. Geoelectrical resistivity sounding
The use of electrical resistivity measurements has been a favorite tool of geophysicists because of the wide range of resistivity values found in nature which represents a greater dynamic range for this technique than most other commonly used methods. The resistivity soundings conducted in this work concerns with a DC resistivity survey utilizing the well-known Wenner array.
A total of 6 Vertical Electrical Soundings (VES) was conducted using Wenner array to measure the surface and subsurface variation in resistivity. The electrical resistivity survey is based on measuring the potentials between one electrode pair while transmitting direct current (DC) between another electrode pair. The depth of penetration is proportional to the separation between the electrodes, in homogeneous ground, and varying the electrode separation provides information about the stratification of the ground (Dahlin 2001).
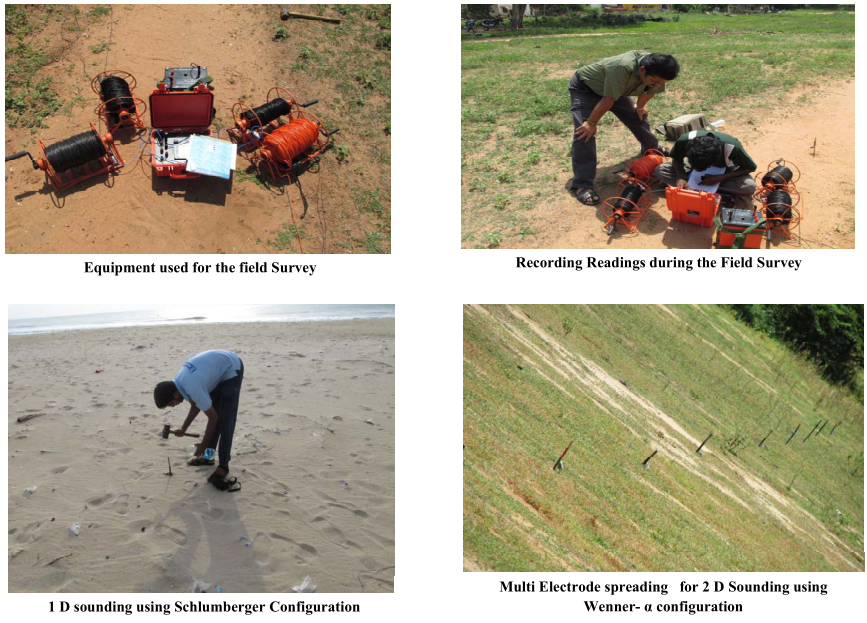
3.3 Equipment
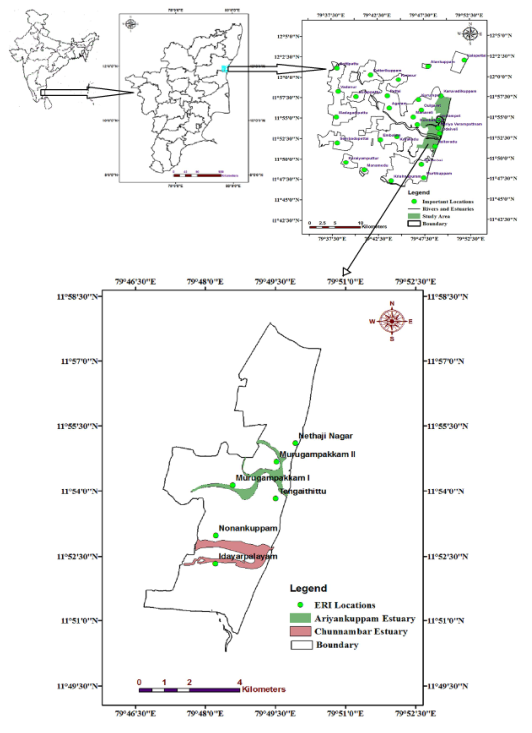
Fig.1 Location of study area and ERI soundings
In the present work WDDS-2/2B Digital Resistivity Meter was used for both the surveys (1D and 2D) at a particular distance orthogonal to the estuaries. The electrodes were stainless steel electrodes pierced 30 to 40cm subsurface. The Wenner - α protocol was applied with a number of electrodes varying from 31 to 32 spaced of 5 and/or 10m leading to an investigation depth ranging from 27.7–55.4m. Salt water was poured to ensure good contact with the earth. Reasonably flat surfaces were chosen for the surveys.
4. Results and discussion
The 1 st profile (Fig.3) was performed at Nethaji Nagar bearing the Latitude E 11°55ʹ7" and Longitude N79°49ʹ55" about 756m orthogonal to the Ariyankuppam estuary. The geoelectrical image shows a variation in resistivity distribution, with electrical resistivity values between 0.152 - 503 Ωm. Lower electrical resistivity values (0.152 Ωm) observed at a depth between 13.4 to 21.5m. The lower values may be due to saline water intrusion and not due to the influence of estuary due to its distance (700m) away from the estuaries. The top layer with resistivity range of 503 Ωm indicates sand formations evenly distributed along both the direction of the profile line. Pockets of intermixed high and low resistivity values are noted along both the directions of the profile with depth between 6.76 and 13.4m might be due to the inter-bedded clay formation. The alternative wet and dry formations along with intermixing of high resistivity formations have given rise to the alternative high and low resistivity zones. Thus, a wide range of resistivity is noted in the profile. In order for better interpretation 1D profile of the sub surface were also interrelated using IPI2WIN software to infer the total layers involved. From the plot two layers were demarcated the first layer as top soil zone with high resistivity (448 Ωm) with a total depth of 3.8m and the second zone interpreted as low resistivity zone (2.45 Ωm) could also be linked with the saline water intruded zone according to the 2D profile. Hence, from the survey the demarcation between the top soil and the adjoining saline water intruded zone is clearly identified at shallow depth. Further the resistivity profile was correlated with the available lithology. From the log it is inferred that the top soil zone are the medium grained sand formations which recorded higher resistivity values up to a depth of 4m and the intermediate traverses of low and high resistivity zones intruded with saline water are mainly due to the fine grained sand, coarse grained sandstone, intermixed with clay formations. Since, the fraction of clay mixing is lower, presence or absence of clay formation did not influence the resistivity values; hence the lower resistivity zone is mainly due to the saline water intrusion into the aquifer formation. From this survey it is confirmed that the saline migration into the coastal aquifers at shallow depth (<30m) and the intrusion is found to be expand deeper inland. The profile (Fig. 4) was performed at Murugambakkam bearing the Latitude E11°48ʹ33" and Longitude N 79°48ʹ33" about 20m orthogonal to the Ariyankuppam estuary with an electrode spacing of 5m between the depths of 150m. The total modeled depth obtained during inversion is about 21.5m. The geoelectrical image shows a lateral decrease in resistivity with increasing in depth due to lithological inhomogeneities. A higher resistivity zone was noted along the western part of the profile at shallow depth (1.25 to 13.5m) indicating the presence of higher resistivity top soil zone. A lower resistivity zone was noted at shallower depth along the eastern part of the profile line and extending up to a depth of 21.5m indicating the persistence of the single layer and from field observation, this layer is interpreted as sandstone formation. This lowering of resistivity is mainly due to the influence of the Ariyankuppam estuary due to its proximity (36m) near the survey line. From the resistivity value observed no traces of saline water intrusion were observed but the lower resistivity zone along the western part of the profile line at a depth of 13.4 to 21.5m might be due to the influence of estuarine environment. For further confirmation the 1D profile at the same
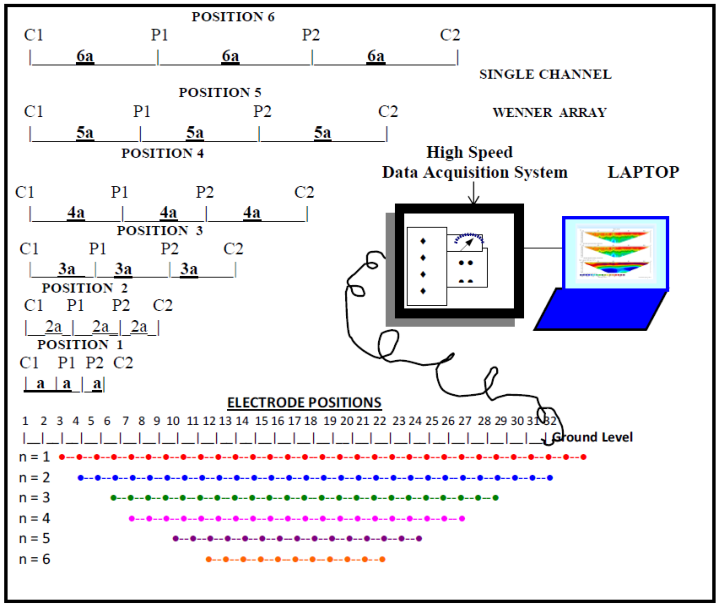
Fig.2 Schematic diagram of Multi-Electrode System
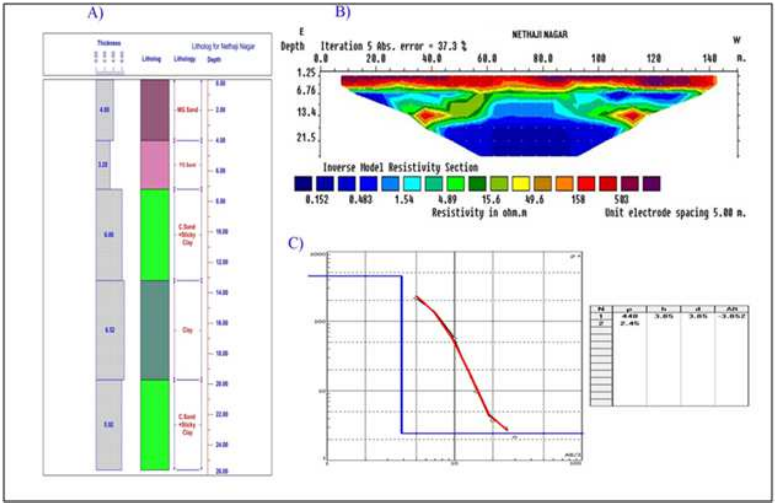
Fig.3 Litholog (A), ERI profile (B) and VES (C) of Nethaji nagar
location were taken for interpretation. From the profile, a total of three layers were demarcated. The first layer with a resistivity range of 12.3 Ωm up to a depth of 2.5m is in good correlation with the top soil resistivity values noted from the 2D profile. The second layer with a resistivity range of 6.91 Ωm up to a depth of 31.5m is interpreted as the zone influenced by the estuarine environment. A third layer after a depth of 31.5m recorded with lower resistivity values of 0.209 Ωm is recorded might be due to the influence of clay formations. For further information a litho log from the nearby location is taken for the interpretation of the layers involved. From from estuaries should have the resistivity values > 1.0 Ωm, but the resistivity range of the identified aquifer is below 1.0 Ωm and in close proximity with the resistivity value of sea water. Hence from the plot it is inferred that saline water intrusion is the dominating factor that influences the resistivity of the aquifer water. For further confirmation the 1D profile at the same location were taken for interpretation. From the investigation a total of three layers were demarcated. The first layer with a resistivity range of 12.3 Ωm up to a depth of 2.5m is in good correlation with the top soil resistivity values noted from the 2D profile. The second layer with a resistivity
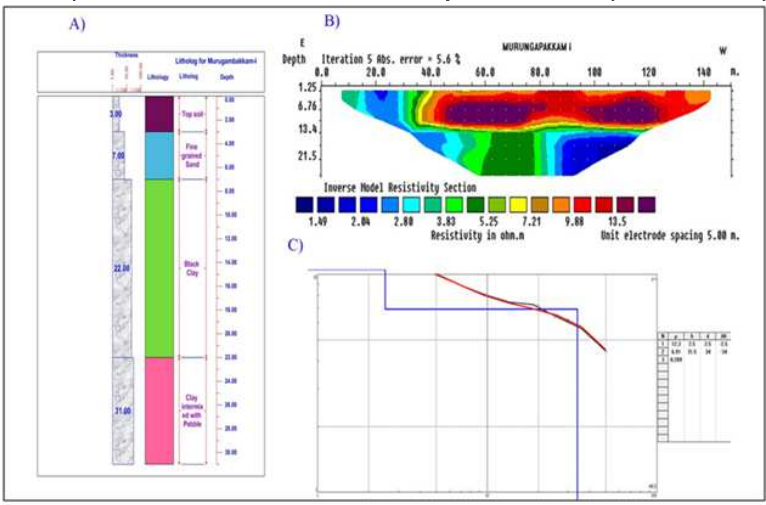
Fig.4 Litholog (A), ERI profile (B) and VES (C) of Murugampakkam I
the litho log data the top soil up to a depth of 3m is confirmed. The second layer up to a depth of 7m is the fine grained sand formation which is in conformity with the field data. Hence the influence of Ariyankuppam estuary which is contaminated due to the release of effluents has influenced the resistivity value of the second layer with gradual decrease in the resistivity. The third formation with still lower resistivity is mainly due to the presence of clay formation. Hence, from the plot it is inferred that the lowering in the resistivity value is mainly due to the influence of Ariyankuppam estuary and no traces of saline water is found.
The profile (Fig. 5) was performed at Murugambakkam-II bearing the Latitude E11°54ʹ40" and Longitude N79°49ʹ32" about 150m orthogonal to the Ariyankuppam estuary with an electrode spacing of 5m between the depths of 150m. The modeled depth obtained during inversion of the data is about 21.5m. The geoelectrical image shows a lateral decrease in resistivity with increasing in depth indicates the inhomogeneities in lithology. The higher resistivity layer identified up to a depth of 3m may be the top soil zone with a resistivity range of 335 Ωm. Followed by the top soil there was a gradual decrease in the resistivity with depth indicating the inhomogeneities of the subsurface formations. A lower resistivity zone identified along the eastern direction of the profile at a depth of 6.76m and found to extend up to a depth of 21.5m seems to spread laterally indicating the influence of contaminated/saline water intrusion. Due to proximity of Ariyankuppan estuary (100m) the influence might also play a dominant role in water chemistry. If the dominance of Ariyankuppam estuary has to be taken into consideration, the resistivity of water influenced by contamination range of 6.91 Ωm up to a depth of 31.5m is interpreted as the zone influenced by saline water. A third layer after a depth of 31.5m recorded with a lower resistivity values of 0.209 Ωm, might be due to the influence of saline water intrusion at deeper depth which could not be identified from this profile. Since no litho logs were found from the above locations no attempt has been made for its interpretation.
The profile (Fig. 6) was performed at Tengaitittu at about 338 m away from the Ariyankuppam estuary bearing the Latitude E11°53ʹ48" and Longitude N79°49ʹ30" with an electrode spacing of 10m between the depths of 280m with a total vertical depth of 43.0m. First layer Inverse model resistivity 2D section shows lower resistivity up to a depth of 26.9m followed by a high resistivity layers showing lateral inhomogeneities. The second layer is between depths 26.9 to 43.0m with resistivity values from 4.09 to 8.34 Ωm. From the first layer resistivity value it is inferred that the formation might be the top soil with sand formation due to its lower resistivity values. The resistivity value was in conformity with the sea water resistivity which indicates the saline water intrusion into the top soil zone. The second layer with medium resistivity values is inferred as clay formation admixed with sand. To further gain insight regarding the layers involved, resistivity sounding was attempted which demarcated two layers with varying resistivity values. The first layer with a low resistivity values (0.325 Ωm) demarcates the layer as top soil contaminated with saline water and the second layer with resistivity values of 36.7 Ωm may be interpreted as clay mixed sand formations with varying grain sizes. Traces of saline water up to a depth of 26.9m are identified in the present area. Since no litho logs were identified for the present study no attempt has been made for cross correlation with the logs.
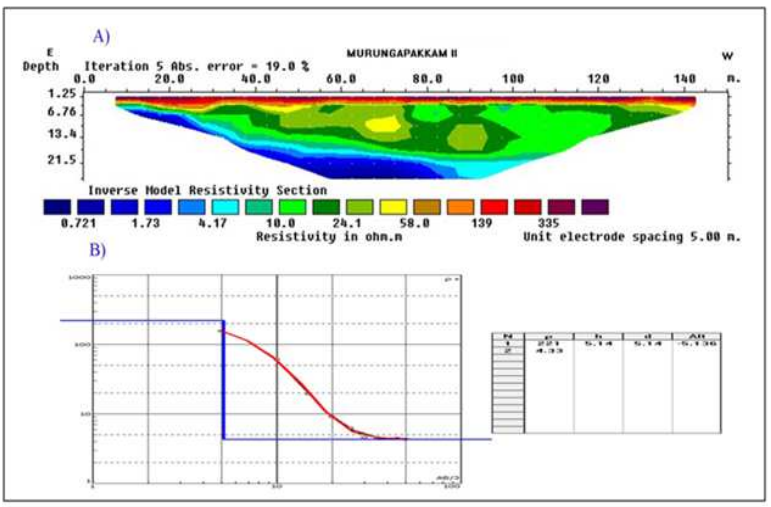
Fig. 5 ERI profile (A) and VES (B) for Murugampakkam II
The profile (Fig. 7) was performed at Idayarpalayam bearing the Latitude E11°52ʹ20" and Longitude N79 ° 48ʹ11" about 10m away from the Chunnambar estuary with an electrode spacing of 5m between the depths of 140m with a total vertical depth of 26.2m. First layer Inverse model resistivity 2D section shows higher resistivity up to a depth of 13.4m followed by a low resistivity layers showing lateral inhomogeneities. The second layer is between depths 13.4 to 26.2m with resistivity values from 1.73 to 2.91 Ωm. From the first layer resistivity value, it is inferred that the formation might be made up of top soil with sand formation due to its higher resistivity values. The second layer is found to be influenced by the presence of estuaries due to its lower resistivity values. The formation identified was the clayey sand formations. The presence of clay formations might be the reason for lower resistivity values, but the uniform resistivity values might not be due to the presence of clay formations, since the clay sand matrix is not continuous and found to be varying with width and depth. Hence if the clay sand formations are responsible for lower resistivity values then there should be variation in resistivity value with reference to the clay sand matrix. But no such variations in resistivity values were observed and the value was uniform throughout the section, hence it is inferred that lower resistivity values are mainly due to the influences of the estuarine water quality which is found to be severely affected due to the discharge of contaminants into them. Hence from the plot it is
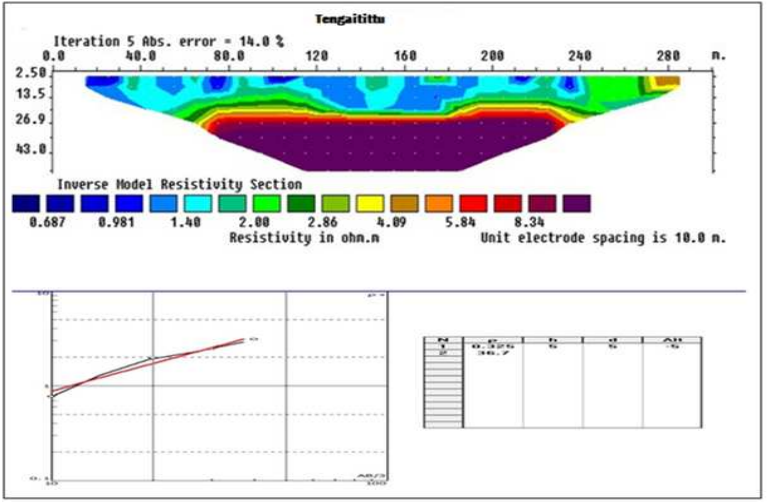
Fig. 6 ERI profile (A) and VES (B) of Tengaitittu
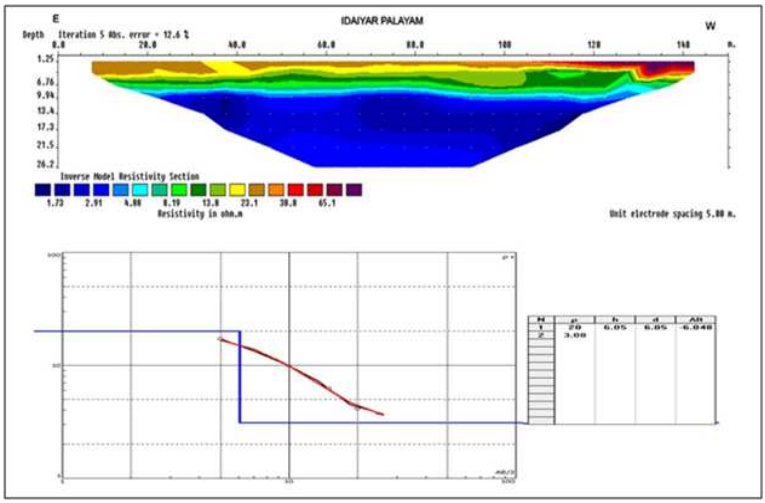
Fig. 7 ERI profile (A) and VES (B) of Idayarpalayam
confirmed that the second layer is mainly due to the estuarine water that has resulted in lower resistivity values. A clear divide between the top soil and the adjoining formation is observed at a depth of 13.4m. To further gain insight regarding the layers involved, resistivity sounding was attempted which demarcated two layers with varying resistivity values. The first layer with a high resistivity values (20.0 Ωm) demarcates the layer as top soil sand and the second layer with resistivity values of 3.08 Ωm might be due to the influences of estuarine water admixed with the clayey sand formations. Hence from the plot, the formations are not being affected by saline water intrusions; the lower resistivity is mainly due to the influence of estuarine environment.
The profile (Fig. 8) was performed at Nonankuppam bearing the Latitude E11°53ʹ12" and Longitude 79°48ʹ13" about 320m away from Chunnambar estuary with an electrode spacing of 5m between the depths of 140m with a total vertical depth of 26.2m. First layer Inverse model resistivity 2D section shows higher resistivity up to a depth of about 19.94m followed by a low resistivity layers showing lateral inhomogeneities. The second layer is between depths 19.9 to 21.5m with resistivity values from 4.15 to 21.5 Ωm. From the first layer resistivity value it is inferred that the formation might be made up of top soil with sand formation due to its higher resistivity values. The second layer with medium resistivity values is inferred as sandstone admixed with clay formation. A clear divide between the clayey sand formation and the sandy clay formations is observed at a depth of 21.5 to 26.2m along the eastern part of the profile. Increase
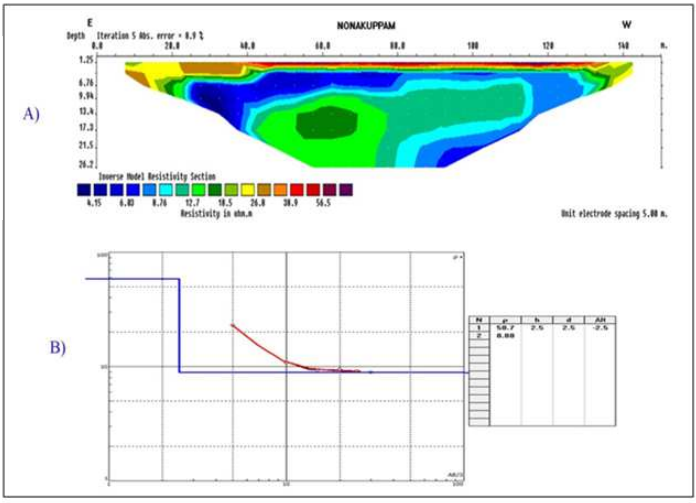
Fig. 8 ERI profile (A) and VES (B) of Nonankuppam
in resistivity values along the left side of the profile indicates the massiveness of the sandy clay formation. A patch of lower resistivity zone (4.15 Ωm) is found along the left portion of the profile at a depth of 13.4 to 21.5m indicating the coarse grained nature of the sandy clay formation. To further gain insight regarding the layers involved, resistivity sounding was attempted which demarcated two layers with varying resistivity values. The first layer with a high resistivity values (58.7 Ωm) demarcates the layer as top soil sand and the second layer with resistivity values of 8.8 Ωm may be interpreted as sand mixed clay formations with varying grain sizes. There were aslight difference between the inference made between the 2D and 1D investigations where the second layer interpreted by 2D demarcates the second layer with low resistivity values and the third layer as the layer with higher resistivity values but in the 1D investigations the top soil zone has been demarcated where the other formations have been linked together in the inversion process so that a complete 2 layer case has been reported. The influence of estuaries could not be identified from the survey might be due to its location which is 300m away from the estuaries. Since no litho logs were identified for the present study area no attempt has been made for the correlation with the litho logs.
5. Conclusions
The expansion of human and agricultural activities in estuarine environment had resulted in inferior groundwater quality, lowering of groundwater levels and land subsidence. The hydrostatic balance between seawater and groundwater brakes causing saline intrusion into the adjoining groundwater environments. An attempt has been made in the coastal Pondicherry region to demarcate the influences of estuaries on the groundwater quality using electrical resistivity imaging techniques. The two main estuaries of Pondicherry region the Ariankuppam and Chunnambar have been attempted for the present study due to inferior quality of estuarine water. Electrical resistivity imaging and electrical resistivity surveys were attempted in six locations with electrode spacing of 5 to 10m with a profile length of 150m to a depth of 27.6m. The first profile performed at Nethaji nagar about 756m away from Ariyankuppam estuary recorded resistivity values from resistivity values from about 0.152 - 503 Ωm. Saline migration into the coastal aquifers at shallow depth (<30m) was noted in the clay formation interbedded with coarse grained sandstone formation. No traces of estuarine influence on the groundwater quality were observed due to its greater distance from the estuaries. The second profile was performed at Murugambakkam very near to the Ariyankuppam estuary. A lower resistivity zone made up of coarse grained sandstone was noted at shallower depth along the eastern part of the profile line up to a depth of 21.5m indicating the influence of Ariyankuppam estuary due to its proximity (36m) near the survey line. No traces of saline water intrusion were observed. The third profile was performed about 150m orthogonal to the estuary. Lower resistivity zone (6.91 Ωm) was identified at a depth of 6.76m and to extend up to a depth of 21.5m indicating the influence of contaminated nature of groundwater due to saline/estuarine environment. The estuarine influence on groundwater could not be demarcated due to non availability of litho log with reference to the presence data. The fourth profile performed at Idayarpalayam about 10m away from the Chunnambar estuary. A total of three layers were demarcated in which the second layer in between depths 13.4 to 26.2m with resistivity values from 1.73 to 2.91 Ωm was demarcated as the zone influenced by estuarine water due to lower resistivity values. The formation identified as estuarine influenced has been demarcated as the clayey sand formation. The next profile was attempted about 320m away from Chunnambar estuary. The fifth profile was attempted about 10m away from the Chunnambar estuary which demarcated three layers. First layer Inverse model resistivity shows higher resistivity up to a depth of about 13.4m followed by a low resistivity layers (65.1 Ωm). The second layer resistivity value ranges between 1.73 to 2.91 Ωm indicating the layer influenced by estuaries. The formation identified was the clayey sand formations. The sixth profile was performed about 320m away from the estuaries. This profile also demarcates three layers with a total depth of 26.2m. The second layer is between depths 19.9 to 21.5m with resistivity values from 4.15 to 21.5 Ωm, inferred as sandstone admixed with clay formation. The influence of estuaries could not be isolated due to its distance from the estuaries. Hence the lower resistivity value is mainly due to litho units and not due to estuaries. Hence from the resistivity investigations the survey locations in close proximity with estuaries were found to be influenced by the estuaries and the locations away from the estuaries were influenced by other factors like saline water intrusion and litho units.
 ENGLISH
 Chinese
 Russian

