Magnetic, geo-electric, and groundwater and soil quality analysis over a landfill froma lead smelter, Cairo, Egypt
Abstract:
A detailed groundmagnetic survey, geoelectric vertical electric sounding (VES), and groundwater and soil quality analysis were conducted in the area of the abandoned landfill of the Awadallah lead (Pb) smelter, northeastern Cairo, Egypt. The integration between the applied techniques located successfully the buried solid waste, demarcated the groundwater and its possible contamination, and determined the lead level in soil.
Magnetic survey comprised 50 magnetic profiles each 190 m length. Vertical derivatives, wavelength filters, and continuation filters characterized the eastern and central parts of the landfill by high intense magnetic anomalies reflecting metal and lead wastes, whereas the western part was characterized by low intense anomalies indicating change in the landfill composition to non-magnetized material.
The geoelectric survey comprised 16 VES with a maximum AB/2 of 100 m. The inverted data demarcated effectively the groundwater aquifer with depth ranged from 11 to 18 m and true resistivities ranged from 96 to 118 Ω·m. The second layer (Holocene-Q3) of semi-permeable silty and sandy clay cap (true resistivities 29~51 Ω·m and thickness 9–17 m) constituted a considerable role in limiting the possible contamination from the landfill.
The analyzed groundwater parameters pH, Eh, TDS, SEC, and DO indicated a good water quality with homogenous aquifer characteristics,whereas the lead concentration in groundwater (0.033–0.036 mg/L)was slightly exceeding the safe limits identified by the U.S. EPA (≤0.015 mg/L). Lead in soil samples revealed elevated concentrations (3130 mg/L/kg at VES-3) around the Awadallah smelter, whereas a gradual decrease in concentrations was recorded in the northwestern direction.
1. Introduction
Lead (Pb) is a metallic element found everywhere in the human environment as a result of industrialization. It becomes extremely hazardous in air, soil, and groundwater environment when involved in a series of complex chemical and biological interactions (Labib and Khalil, 2006; Safar et al., 2007). Known effects of exposure to lead range from subtle changes in body chemistry and nervous system functions at low levels of exposure, to severe toxic effects or even death at very high levels associated with acute poisoning (WHO). Some harmful effects are reversible if exposure is reduced, while other harmful effects can be permanent. Young children, infants, and fetuses appear to be particularly vulnerable to harmful effects of lead (Labib et al., 2007). A dose of lead that would have little effect on an adult can have a big effect on a small child (Agency for Toxic Substances and Disease Registry, 2006). Therefore, identification of lead pollution sources in the environment andmonitoring its contamination in the soil and groundwater are mandatory, especially in the highly affected areas.
The area under investigation is the abandoned landfill of Awadallah lead smelter. It is located in Shoubra El–Kheima district, northeastern Cairo, 500 m southwest of the former Awadallah lead smelter (Fig. 1) which was the largest illegal lead smelter from 1999 to 2004 (Labib and Khalil, 2006). Shoubra El–Kheima district is highly polluted by industrial wastes (mainly lead) due to the presence of randomly distributed illegal lead and copper smelters (Safar et al., 2007). In June, 2004 Egyptian Environmental Affair Agency (EEAA) closed the Awadallah lead smelter due to many environmental concerns. From 1999 to 2004, Awadallah lead smelter used the study area (Fig. 1) as a landfill to dump and bury lead sludge and waste. Furthermore, the local inhabitants used the same landfill for domestic wastes as well. The dimensions of the landfill extend for 190 m length, 100 m width, 1–3.5 m depth (Fig. 1), and located in the core of the over populated (almost 62,000 people) residential area of Shoubra El–Kheima. Initial investigation in the area indicated that the soil is the major host for lead released by the lead smelters and/or human activities (Labib et al., 2007; Safar et al., 2007). Further investigations were carried out through this study to locate the buried solid waste of the landfill, determine the level of lead pollution in the soil, and investigate groundwater contamination as well. In that context, as a part of a multi-techniques environmental investigation, a ground magnetic survey, geoelectric vertical electric sounding (VES) survey, and soil and groundwater quality analysis were carried out over the abandoned landfill of the Awadallah lead smelter.
2. Site description
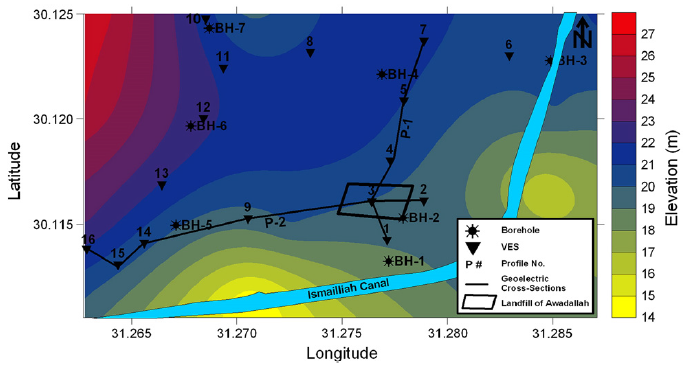
The study area is a part of the urban/industrial city of Shoubra El–Kheima, northeastern Cairo, south of the Qaliubyia Governorate, 3300 m east of the Nile River, 374 m north of Ismailliah Canal and bounded by latitudes 30.114° and 30.116° N and longitudes 31.274° and 31.278° E (Fig. 1). Most of the geological and geophysical investigations carried out in the study areawere for construction engineering and groundwater exploration (e. g., Atta, 1979; Maha, 1984; Maher, 1996; Safar et al., 2007). Noteworthy, these studies have contributed significantly to understand the stratigraphic and structural setting of the area (Maher, 1996). The topography of the area is characterized by gentle slope with gradual increase in altitude ranging from 14 to 27 m amsl (Fig. 2). The area is characterized by arid climatic conditions (Atta, 1979). Annual rainfall is low with a long-term average of 20 mm/year. Average daily air temperatures are ranging between 30 °C in the summer and 13 °C in the winter (Maha, 1984). The potential evapotranspiration is more than 4000 mm/year with a maximum rate in the summer that exceeds 12 mm/day (Safar et al., 2007). The area, in general, is a part of the Northern tip of the Nile Delta and alluvial plain (Atta, 1979). Such silty and sandy clay deposits (Holocene-Q3) are overlaying a graded sand and gravel Pleistocene aquifer (Pleistocene-Q1). The main aquifer belongs to the Quaternary formation (Nile-recharged formation) (Maha, 1984). Boreholes in the study area indicated four subsurface layers, from top to bottom as follows (Fig. 3):
1. A surface layer characterized by a mixture of silty and sandy clay cap (Holocene-Q3) and different building wastes. This layer characterized by thickness ranges from 0.1 to 1.5 m.
2. A second layer of silty and sandy clay cap (Holocene-Q3). This layer characterized by thickness ranges from 1.5 to 11.5 m.
3. A third layer of mixed sand and gravel (Pleistocene-Q1). This layer represents the aquifer and characterized by thickness ranges from 100 to 130 m.
4. A fourth layer exists below the aquifer and consists of very impermeable rigid clay.
In the study area, the predominant flow of the groundwater is from the south to the north and from the west to the east (Atta, 1979; Maher, 1996). There are some secondary movements due to some depletion in the groundwater level due to excessive pumping (Safar et al., 2007). The main source of groundwater recharge is the River Nile and Ismailia canal (Fig. 1). The secondary recharge source is seepage from sewage system and drainage networks. The groundwater discharge is mainly from wells and boreholes (Safar et al., 2007).
3. Methodology
3.1. Ground magnetic survey
The magnetic method is frequently used in studies over landfills in search of buried magnetic material (e.g., Blasting, 1987; French et al., 1988; Keiswetter and Won, 2000; Pozza et al., 2004; Walsh, 1989). Commonly, the location(s) of shallow (b4 m) magnetic material such as metal waste, buried barrels, pipes, and/or domestic waste is the primary concern.
Magnetic data processing with enhancement techniques substantially improves the interpretability of the collected magnetic data (e.g., Lidiak et al., 1985; Petar Stavrev, 2006; Peter Furness, 2007; Urquhart and Strangway, 1985; Yarger, 1985). The objective of various enhancement techniques is to accentuate the particular characteristics of anomalies to increase their perceptibility (Hinze and Zietz, 1985). Different wavelength and wavelets filtering procedures can play significant roles in the separation of the shallow and deepmagnetic source anomalies (e.g., Bott, 1973; Fedi and Quarta, 1998; Hinze and Zietz, 1985; Paoletti et al., 2007; Roberts et al., 1989). When dealing with large data-sets, digital filtering is more efficiently accomplished in the wave number domain (Bhattacharyya, 1965) using discrete Fouriertransform algorithms (Brigham, 1974).
In the study area, ground magnetic survey comprised 50 magnetic profiles each 190 m length. Magnetic data were collected digitally using a WCZ-1 proton magnetometer (precision±1 nT and resolution 0.1 nT). Observations were conducted at a height of one (1) meter above the ground surfacewith separation 2 minterval. The diurnal variations in the total magnetic field data were monitored every 2 min with an EG&G Geometrics G-856A base station magnetometer located off the landfill. The package of Geosoft Oasis Montaj (2007) used to apply various filters such as the reduction of the data to the magnetic pole, vertical derivatives (first and second vertical derivatives), wavelength filters (high-pass and low-pass filters), and continuation filters(downward and upward continuations).
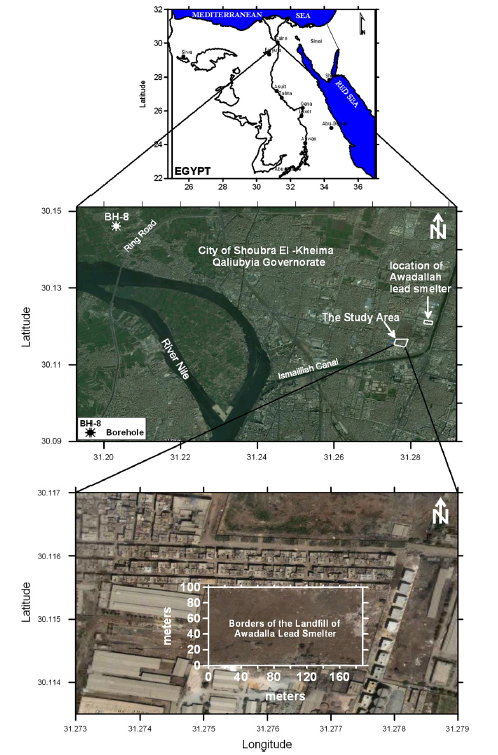
Fig. 1. A location map of the landfill of Awadallah lead smelter, Northeastern Cairo, Egypt (GeoEye April, 2011; datum for geographic coordinates is WGS 84).
Fig. 2. The topographic contour map of the study area, Northeastern Cairo, Egypt.
3.2. Geoelectric resistivity survey
Direct current (dc) vertical electrical soundings (VES)method measures the apparent resistivity of the subsurface (Khalil, 2010; Reynolds, 1997). In a complicated sedimentological environment, geoelectric resistivity is one of the most variables reflecting the physical properties. Apparent resistivity data can be inverted to develop a model of the subsurface structure and stratigraphy in terms of its electrical properties. Geoelectric resistivity depends mainly on the lithology, water content, porosity, and ionic concentration of the pore fluid (Khalil, 2009). Therefore, the ambiguities in interpretation may occur and become very necessary to calibrate the observed VES data with the available borehole data to assign resistivity ranges for the various lithologic units (Khalil, 2006). Resistivity data can be used to identify, delineate, andmap subsurface features such as electrically conductive contamination plume, the salt/fresh water interface, the vadose zone, and sediment size distribution (e. g., Descloitres et al., 2008; Halihan et al., 2005; Khalil, 2010; Oldenborger et al., 2007).
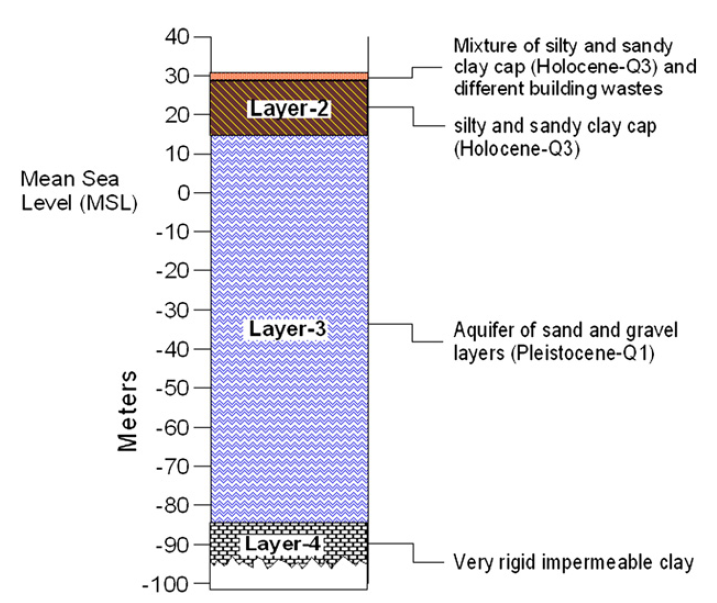
Fig. 3. Generalized subsurface stratigraphic section in the study area.
As the study area is highly residential, a reconnaissance field survey was planned to establish the suitable locations of the resistivity measurements (VESs) according to the availability on the ground and boreholes in order to calibrate the resistivity data (Fig. 2). In this respect, sixteen Schlumberger VESs, with a maximum current electrode half-spacing (AB/2) of 100 m were conducted in the study area to demarcate the depth of the groundwater aquifer. This spacing was adequate to penetrate down to the target layer (10–18 m depth) of the sand and gravel water aquifer (Pleistocene-Q1). Resistivity measurements were carried out using a high accuracy digital signal-enhancement resistivity-meter (GISCO USA, ABEM-TERRAMETER, SAS 1000).
Field datawere interpreted through the following steps; (a) matching the field curve with the standard curves of the auxiliary method (Marsden, 1973; Mooney et al., 1966), (b) preparing an initial geoelectrical model (thicknesses and corresponding resistivities) for a limited number of layers depending on the geological background as well as the borehole information in the study area (Patella, 1975), and (c) entering the initial geoelectrical model into the Van Der Velpen (1988) geoelectric modeling package. Each VES is subjected to 1D-forward modeling, in which the iterative procedure of Zohdy (1989) was applied. Iterations were carried out to reach the best fit between the smoothed field curve and the calculated one. The maximum root mean square (RMS) errors of the resulting models are 5%.
3.3. Groundwater and soil samples/measurements
A sampling vehicle, equipped with necessary tools was employed to collect groundwater samples from the available boreholes in the study area. These tools comprised a handheld device (water quality instrument MYRON L TechPro II) for continuous onsite measurements of specific electrical conductivity (SEC), total dissolved solids (TDS), temperature, dissolved oxygen (DO), oxidation–reduction state (Eh) and power of hydrogen (pH). Furthermore, a submersible pump was used for pumping and taking samples either at step or long duration performance. A compressor or air liftwas used for cleaning of boreholes before taking of samples. Filtering instruments including a 0.45‐micro filter was changed between each filtering process. In the study area, pH, Eh, EC, Pb, TDS, DO, and DO% were analyzed for groundwater and Pb concentration in soil was analyzed aswell in order to investigate any possible groundwater and/or soil contamination. For each element of groundwater, seven samples from BH-1 to BH-7, 6 duplicates, 1 blank, and 6 cross references were conducted, whereas sixteen soil samples were collected very close to the conducted sixteen VES stations (Fig. 2).
 ENGLISH
 Chinese
 Russian

