Application of Multi-Electrode 3D Resistivity Imaging System On Inspecting Water Content under the Mine floor
Abstract: At present, the multi-electrode 2D resistivity imaging technology can easily inspect water content under the mine floor,but unable to prospect the water content inside the mine face before mining. Today, this task can be achieved through multi-electrode 3D resistivity imaging technology. We lay cables around the mine surface, apply 2-pole vertical electric sounding, in association with 3D imaging technology and data processing software, eventually acquires the 3D data of the mine face floor, as well as 3D data of vertical and transverse slices. The proof is the example elaborated in this paper, a survey project performed in Xiezhuang Mine of the Xinwen Coal field, of 71504W mine face. This example devotes on introduction to multi-electrode 3D resistivity imaging technology on inspecting water content under the mine floor, on sampling 3D data before mining, on imaging the 3D resistivity data of water content and lastly on vertically and transversely slicing the inversed data. The final inversed images directly and clearly show the water content under the mine floor. 3D resistivity imaging is a practical and effective approach in inspecting water content under the mine floor.
Keyword: Multi-electrode 3D, water content, 3D imaging, slicing technology
1. On Technique
The problem we are facing now on mining face prospecting with downhole dipole technology is, that the resistivity data of the mine floor obtained is overall reflection of the transverse profile of the mine face, which is greatly affected by various factors. Though it reflects the general features of the rock inside the mine face, but shows no specific resistivity data of a certain point inside the mine face (1~2).
The 3D resistivity imaging introduced herein this article works like this: electrodes are laid inside the mine tunnel, encircling the mine working face. Electrode array configuration is 2-pole vertical electric sounding, current electrode B and potential electrode N are located infinity far away. Vertical electric sounding is realized by increasing the distance between current electrode B and potential electrode N. Data acquisition system is Super Multi-electrode Resistivity/IP Imaging System by BTSK, data transfer software is the BTW2000 data communication software, and inversion software is Res3D INV. FFinally, we obtain a 3D resistivity inversed model of the rocks at a certain depth beneath the mine working face, and then we slice the data vertically and transversely, acquire the resistivity information of every data point beneath the mine working face, and thereafter analyze water content of the working face floor.
2. 3D Resistivity Tomography Imaging
No matter whether it is 3-pole electric sounding, or 2-pole electric sounding, both of the data sampled are two-dimensional (2D) data, in other words, survey line can only leads to acquisition of a profile that is parallel and beneath the survey line, which is extremely limited for hydrogeology prospecting. For instance, to perform multi-electrode 2D survey on a rectangle mine working face, along the floor and roof of the mine tunnel, what we can acquire is profile of the floor of the mine tunnel, without detailed information of the floor of the mine working face itself. However, for the technicians, what’s important is the latter, water content of the mine working face floor. 3D resistivity imaging technology makes use of the multi-electrode transmitting unit and receiving unit to electrically scan the underground rock, and CT
imaging according to the resistivity difference of the earth. If the transmitting unit and receiving unit are settled reasonably, it surely will show enough data point and severe potential anomaly of the underground or of the underground mine. Then we can go on to data handling and inversion calculation to educe resistivity distribution
of the underground rocks. On judgment of the relationship between resistivity and water-bearing rock we can interpret the water boundary and the distribution of the waters; on judgment of the relationship between the water resistivity and water content, we can depicture a 3D model of water distribution, and therefore predict water distribution as well as water volume inside the mine working face.
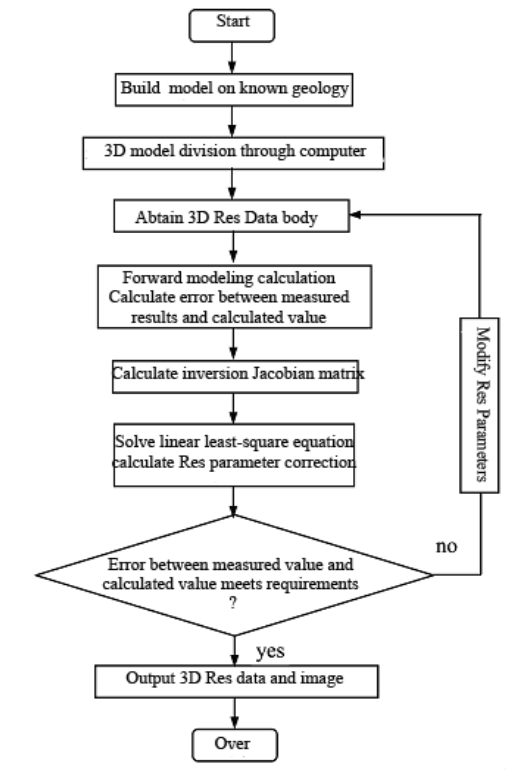
3D resistivity inversion procedure is as show in Fig.1.
3. Data Sampling & Handling
Data handling procedures of multi-electrode 3D resistivity underground mine imaging mainly involves the following steps:
(1). Delete abnormal data point: during data acquisition process, some abnormal data may appear because certain electrode is not grounded well or is interfered by field factors. To avoid influence on the interpreted data, delete these bad data points in time.
(2). Smooth and balance the data: during the process of data sampling, there may be noise recorded. To eliminate the noise generated by the instrument itself, smooth and balance the data, but DO NOT too much to avoid lost of useful information and descending resolution.
(3). Build inversion model: 3D mode is a cubic space formed by the level surface that is parallel to the survey region face, X and Y axis, composed of many a cuboids, the adjacent four electrodes forms one face, that is to say, length and width of a cuboid equals to one unit electrode spacing. Height of the top cuboid is 0.7 times of one unit spacing, height of the lower cuboids of the models increasing 15% based on the cuboids of the upper layer. To increase inversion precision, the 3D model can be further subdivided into to another two variations, one way is to vertically and transversely cut the subdivisions to get 8 same-sized smaller ones; the other is simply to vertically cut the subdivisions to get 4 smaller one. In that the resolution of resistivity survey is weakening as depth increases, the calculation indicates that the subdivided model should not be more than two layers. Generally, one subdivision layer is enough, for the more the subdivision, the longer time the inversion process takes.
(4). Data inversion:
3D resistivity survey system uses “Smoothness-constrained Least Square” principle. “Least Square” is a mature and most optimized inversion approach and has been widely applied in geophysical prospecting field. In addition, the program is written with Quasi-Newton optimized non-linear least square calculation, which makes calculation speed 10 times faster than the ordinary least square with mass data, but takes up less memory, damping resistance and smoothing filter are adjustable to meet various kinds of information. Smoothness-constrained Least Square inversion optimization method also minimizes the difference between forward modeling value and the measured apparent resistivity through adjusting resistivity of the 3D model.
First, we preliminarily build submodels according to the measured apparent resistivity value, calculating with Finite Element Analysis (FEA) or Finite Difference Method (FDM) to perform forward modeling, and obtain a preliminary model of apparent resistivity anomaly model. The program then compares the forward modeling value and the measured value, according to which resistivity of the submodels are adjusted. Next, again perform forward modeling calculation on the adjusted model. It repeats the above process on modeling time and again, and the difference between the forward modeling calculation and measured value is decreasing. The error is measured by Root-mean-square (RMS). We generally take the inversed data model as the final where RMS error has no much change at the third or the fifth iteration.
4. Survey Example
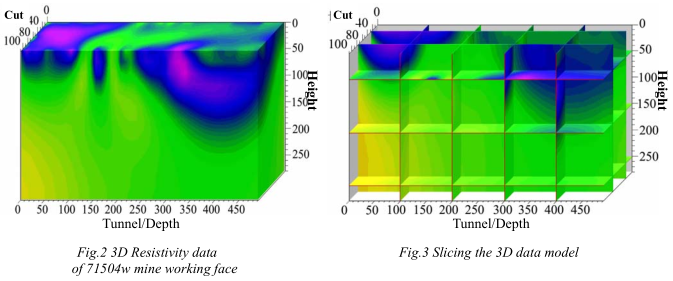
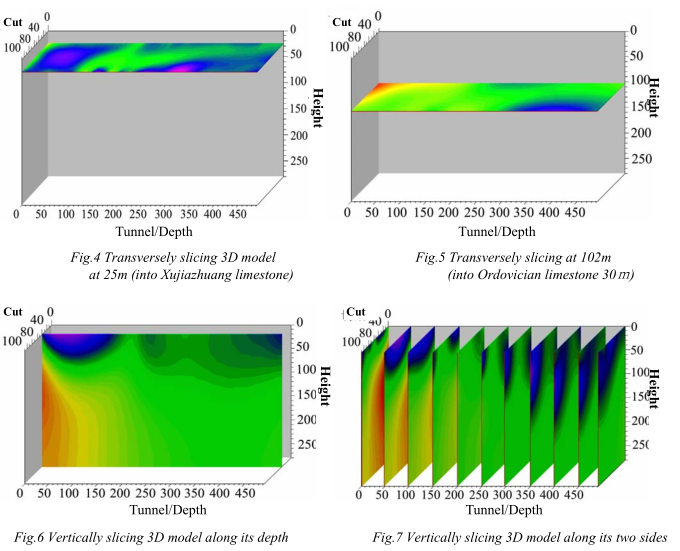
Data process of this survey practice finally gives us a 3D resistivity data model of the 71504 mine face floor, Xiezhuang coal mine, Xinwen coal field. The mine working face model is 490m long, 110m wide, 280m high. Origin of the model is the joint of the floor and the cut. Positive length direction of the model is along the outside of the floor, positive width direction is along the upper walking of the cut, both in unit of meter (m). Depth direction is vertical to the strata but not perpendicular.
The following data interpretation is based on the 3D models, and the vertical and transverse slices. Low resistivity indicates rich water content; high resistivity indicated poor water content. In figure 2~7, it is obvious that there are two low-resistivity anomalies. One is inside the mine working face, about 150m away from the cut, yet not deep, no more than 50m, just deep into the Xujiazhuang limestone, not into the Ordovician limestone. Another low-resistivity anomaly is at the outer side of the mine working face, deep into the working mine face about 150m, near the mine roof, which influences deep into 180m (into both Xujiazhuang limestone and Ordovician limestone). The later borehole surveys on the mine working face and at both the anomalies, DO prove that water content of the Xujiazhuang limestone and the Ordovician limestone is coherent to our prediction.
5. Conclusion
Benefit from technological innovation, it is possible for multi-electrode imaging system to inspect water content of the mine working face, depicture 3D electrical property of the rock in the mine face floor, 3D imaging and slicing, and finally clearly to show the water content inside the mine working face. These results are vivid and direct references for handling mine water-inrush hazards and making strategic decision. 3D imaging data can be sliced vertically and transversely, directly depictures water content of the mine working face floor. 3D resistivity imaging system is practical and effective, worth being developed and applied widely.
 ENGLISH
 Chinese
 Russian

