An integrated geophysical method for investigating hydro-geological characteristics of a debris landslide
ABSTRACT: Debris landslides are one of the most widely distributed types of landslides in the Wenchuan earthquake area. The hydro-geological structure characteristics are the fundamental basis for stability evaluation, performing protection and administration of a landslide. The rock and soil mass of a debris
landslide was highly non-uniform and preferential seepage paths were normally developed in it. Therefore, in situ identification of the underground water seepage system became particularly important. Recently, investigations on the seepage paths of underground water in debris landslides were restricted to indoor model testing and site observation, which were far from meeting the actual demand for landslide prevention and mitigation. To locate the seepage paths, we conducted survey work on a debris landslide seated in the Xishan Village, Li County, Sichuan Province, China, by combing four different geophysical methods. They were multichannel analysis of surface wave (MASW), electrical resistivity tomography (ERT), ground penetrating radar (GPR) and microtremor survey method (MSM). The geophysical interpretation was verified with field engineering surveys and monitoring data. The results suggested that a dendritic pipe-network seepage system usually developed in debris landslides. Varisized infiltration pipes showed the characteristics of inhomogeneity and concentration of the seepage. This work highlighted that geophysical parameters (shear wave velocity Vs, dielectric constant εand resistivity value ρ) could provide reliable qualitative and quantitative information about the colluvial layer, bedrock interface, potential sliding surface and underground water seepage system of a landslide. The optimum combination of geophysical methods was suitable to survey the hydro-geological characteristics of debris landslides in the Wenchuan earthquake area.
Keywords: Hydro-geology; Pipe-network seepage system; Debris landslides; Geophysical investigation; Wenchuan earthquake.
1. Introduction
The southeast edge of the Tibetan plateau was generated by the collision between the Indian and the Eurasian plates, resulting in complex geological tectonics and a series of active large faults (Kind et al., 2002). Since the self-Quaternary, especially the late Quaternary, these deep faults have been very active where earthquakes had occurred frequently, such as the "5.12" Wenchuan Ms 8.0 earthquake in 2008 and the "4.20" Lushan Ms 7.0 earthquake in 2013 on the Longmenshan (LMS) fault belt (Wu et al., 2008;Liu et al., 2013) (Fig. 1 (a)). The destructive earthquakes brought huge losses of lives and properties, and serious deformation and destruction of slopes always accompanied the strong seismic inertia force. The potential safety problem in the earthquake hit area will coexist with the local inhabitants for a long time.
Debris landslides are the most common landslide type in the Wenchuan earthquake area. A soil can be named as gravel soil when the dry weight of particles over 2 mm exceeds 50% of the total dry weight. In general, it is composed of a loose accumulation including artificial filled soil, diluvium, collapsed soil, weathered rock material, etc. Shang et al. (2002) found by engineering geological survey that underground water flow was a pipe-network discharge in a gravel clay slope. Some spring water flowed out from the fissures among rubbles on the toe or back edge scarp of a slope, particularly in the rainy season. The pipe-network drainage system was destroyed or blocked when loading on the slope surface or excavation unloading at the foot of the slope. This might lead to considerable increase in ground water level and pore water pressure in the slope and cause instability of the slope, eventually (Xu et al., 2006; Yu et al., 2007; Sun et al., 2011). Sensitive analysis of influence factors indicated that the main influence factors for the stability of debris landslides were persistent rain, strong rainfall and surface runoff (He et al., 2005, Xu et al.,
2007a, 2008).
The pipe-network seepage system developed in debris landslides significantly influenced its stability. The identification of seepage paths was very helpful for engineering mitigation of landslides. Previous studies on pipe-network seepage systems were concentrated on indoor physical and mechanical tests (Xu et al., 2006), model tests (Shang et al. ,2005; Yu et al., 2007) and numerical stimulation (Xu et al., 2007a, 2007b, 2008; Sun et al., 2011). However, literatures about in situ identification of underground water seepage paths were very rare. Therefore, rapid delineation of seepage paths in debris landslides was undoubtedly important for its stability evaluation and selection of proper mitigation measures.
In the last two decades, geophysical methods were being increasingly applied to delineate landslide structures, including internal geological structure, potential slip surface, hydro-geological feature, movement characterisation, mechanical properties, etc. (Bogoslovsky and Ogilvy, 1977; Bruno et al., 2000; Lapenna et al., 2005; Jongmans et al., 2009; Grandjean et al., 2011; Torgoev et al., 2013). Compared with traditional techniques such as drilling, trenching and tunnelling, geophysical techniques are flexible, relatively quick and deployable on landslides. They are non-invasive to investigate a large volume. Jongmans et al. (2007) gave a detailed review about recent applications of the main geophysical techniques on landslide characterization. They presented the advantages and drawbacks of these techniques and explained the main reasons for their relatively limited application to landslides. Even so, method-optimisation design, resolution and penetration, and reliability of results on the landslide should still be discussed in our study. Shear wave velocity (Vs) is sensitive to inhomogeneous media and interfaces. Therefore, multichannel analysis of surface wave (MASW) is suitable to probe strata, weak intercalation, structural planes and fracture zones in a shallow landslide (Meric et al., 2007; Jongmans et al., 2009; Lima et al., 2012). Electrical resistivity (ρ) is a parameter used to provide information about rupture surface, water content and conductivity, rock weathering and fracturing, as well as water-saturated zones in a landslide (Lebourg et al., 2005; Marescot et al., 2008; Le Roux et al., 2011). Ground penetrating radar (GPR) is a high resolution method, depending on the chosen antennas, with a probing depth from a few centimetres to a few meters in resistive materials. It is sensitive to dielectrics, magnetic contrast, fractures and especially water content, and was used more in rock landslides (Bichler et al., 2004; Otto et al., 2006; Yamakawa et al., 2010). Moreover, the microtremor survey method (MSM) developed in the last decade has no special requirement for the environment because it acquires the structure of shear wave velocity from low frequency vibration signals generated by human activities (Okada et al., 2003). The application of MSM was then concentrated on the mapping of geothermal faults, collapsed columns in coal mines and boulders along subway lines (Ling et al., 2006; Xu et al., 2009,2012). It was also expected to be used in deep seated landslides (more than 50 m deep) investigations.
To delineate the in situ seepage paths in a debris landslide and build its hydro-geological model for further research on numerical analysis and stability evaluation, this study attempted to join four geophysical methods, MASW, ERT, GPR and MSM, to survey four profiles where borehole data were available. The geophysical interpretation suggested that surface and underground water drainage were major measures for the deformation control of a debris landslide.
2. Geological and geotechnical background
2.1 The study area
The study area is located in Tonghua Town, Li County, Ngawa Tibetan and Qiang Autonomous Prefecture, Sichuan Province, China. The Xishan village landslide (31°34'59.40", 103°25'30.99") is seated at the left bank of Zagunao River and nearby No.317 national highway. The average altitude is about 2300 m with high mountains and deep valleys in the study area. Both the Wenchuan Ms 8.0 earthquake in 2008 and the Lushan Ms 7.0 earthquake in 2013 occurred on the Longmenshan fault system as shown in Fig. 1a. The landslide is 40 km away from the LMS fault belt. Therefore, the structure of the slopes was strongly affected by the earthquakes, so that there will be serious safety problems in this region for a few years to come.
The Xishan village landslide with thick overburden layers is a large retrogressive landslide seated between the mountains as shown in Fig. 1b. The landslide is about 3800 m long with a slope angle of 25°~45°. The minimum and maximum widths of it are 680 and 980 m, respectively. The average thickness of the landslide mass is about 55 m. The difference in altitude between the toe and the back edge of it is about 1790 m. The total volume of the landslide is about 1.7 × 10 8 m 3 (Luo 2015). The current local inhabitants living on the landslide are about 724 from 211 households. The houses have been severely deformed and damaged, and have even collapsed after the earthquakes. In addition, strong erosion to the toe from the Zagunao River has increased the landslide deformation, and so many cracks, fallen trees and collapses are being developed on the landslide, which indicates that persistent deformation of the landslide is threatening to villager's lives and properties.
The geological stratum outcropping in the study area is the Maerkang sectional stratum including Devonian system and Quaternary Holocene slope sediments. The underlying bedrock is Devonian system composed of limestone, dolomite, phyllite, and even metamorphic quartz sandstone and quartzite at the bottom (Fig. 2). The cover stratum consists mainly of Quaternary colluvial deposit, gravel clay soil and gravel soil. The river terrace is Quaternary diluvium layer in the front of the landslide. Exposed bedrock that appeared at the back edge and side wall of the landslide was severely eroded with crushed rocks. Joint fissures and small developed faults were obvious on the artificial excavation profiles.
2.2 Engineering geological contexts
The study selected a small landslide as a research object on the Xishan village landslide to show the pipe-network seepage system in the debris landslide (Fig. 3a). The aim was to verify the effect of the application of joint geophysical techniques on the landslide and discuss the optimum combinations. On the other hand, we attempted to conduct a typical exemplary experiment using multi-geophysical methods on this small landslide for further large scale investigation of the Xishan village landslide. The back edge scarps, inclined trees, tensile cracks on the sidewalls (LF4− LF7) and at the toe (LF8 − LF9) of the landslide were evident along with the landslide deformation (Fig. 3b and 3c). The elevation difference of the small landslide was about 126 m with a slope angle of 45° (Fig. 3a). Vegetation coverage in the front of the landslide was high due to the numerous groundwater outcrops (Fig. 3d). Groundwater in the landslide mainly included Quaternary loose deposits pore water and bedrock fissure water from alpine seasonal snowmelt, domestic water and farmland irrigation water. Moreover, the maintenance of the drinking water system in the village was so poor that a huge amount of water was flowing along the landslide surface all year long to produce some water-rich zones in the landslide.
Human engineering activities, such as old house renovations and new house constructions, posed great influences on the stability of the landslide after the earthquakes. Meanwhile, the landslide was seriously excavated to build rural roads and drinking water system, which actually increased the stability of the landslide with unloading (Fig. 4). On the other hand, the pipe-network drainage system in the debris landslide was also damaged by the construction works. Poor drainage enabled rise in the underground water level and decrease in shear strength of the soil, which increased deformation of the landslide and threatened safety of the village. Therefore, groundwater drainage became the main factor affecting the stability of this landslide.
According to the borehole data, shallow strata of the landslide from top to bottom are Quaternary diluvium, gravel clay soil, gravel soil, strongly weathered phyllite, weathered phyllite and phyllite bedrock. Bedrock outcrops on the surface were consistent with the previous geological survey (Fig.2). As shown in Fig. 5, average thickness of the Quaternary diluvium was about 3.5 m, and thickness of the gravel soil was about 50 m on the longitudinal profile ZZ'. Potential failure surface of the landslide was about 52 m in depth bounded by a 5.0 m thick strong weathered phyllite layer with low shear strength, which facilitated further development of a deep seated landslide.
In this study, we selected 4 geophysical surveying lines on the landslide to further learn about the hydro-geological structure based on the previous site investigation. The shallow stratum structure of the colluvial layer was surveyed using MASW and GPR. ERT was used to delineate shallow water saturated zones and seepage paths in the landslide. Surveying lines for the GPR method were P2 and P3, for the MASW method were P1, P2 and P3, and for the ERT method were P1, P2, P3 and P4 (Fig. 3). MASW and GPR could not detect features at greater depth of the debris landslide due to great attenuation of seismic and electromagnetic signals because of the broken characteristics of gravel soil. However, MSM could be used to detect the degree of weathering of bedrock and the rugged shape of the potential sliding surface with low frequency microtremor (Ling et al., 2006; Xu et al., 2012).
Permeability of the shallow loose colluvial layer and gravel soil layer with large porosity was high, so that the pipe-network drainage system played an important role in keeping its stability (Shang et al., 2002; Xu et al., 2006; Yu et al., 2007). The interaction between the overburden layer (Quaternary diluvium and gravel soil) and the weathered phyllite bedrock with high permeability directly determined the stability of the longitudinal profile ZZ' in Fig. 5. Therefore, the evolution of pipe-network seepage paths along depth in the landslide was extremely important for stability evaluation of it.
3. Methodology
3.1 MASW
The MASW method was efficient at probing shallow subsurface structures with high resolution using active sources. MASW was being increasingly applied to survey geologica structure, seismic microzonation, site response studies and geotechnical characterisation of near surface materials (Park et al., 1999; Jongmans et al., 2009; Anbazhagan et al., 2011). Rayleigh wave signals were collected using the layout of a single-ended excitation source and a receiving system with geophones at equal spacing. Inversion dispersion curves were calculated using the frequency-wavenumber (F-K) method to determine how shear wave velocity profiles varied with depth. The investigation depth of MASW roughly corresponded to Vs/3f, and shear wave velocity was sensitive to landslide deformation (Jongmans et al., 2009). This method was increasingly applied in detecting 2D or 3D structures of landslides in recent years (Grandjean et al., 2011; Lima et al., 2012).
The experimental device is an SE2404EI type engineering investigation instrument. The main technical specifications are as follows: 24 data acquisition channels, sampling rate of 25 µs − 10ms, dynamic range over 131 dB, frequency band of 0.1 Hz − 5000 Hz, which meet the demand of Rayleigh surface wave collection. The source is an artificial hammering source created by a 1.5 kg sledge hammer on a steel plate with a diameter of 20 cm. The natural frequency of the geophone is 4.5 Hz. To effectively identify the Rayleigh surface wave record, we compared 2.0 m, 4.0 m and 6.0 m offsets, and ultimately selected the 6.0 m offset. According to the site condition, the parameters used in our tests are as follows: sampling rate of 0.25 ms, 1024 sampling points, 24 channel detectors and 1.0 m track interval.
3.2 ERT
The resistivity value mainly depends on the mineral components, ground water and electrolytes in the underground media. ERT applied direct current to shallow underground media, and then the current flowing in conductive media was received by electrodes arranged along the profile. The resistivity value was calculated to understand conductive properties of the subsurface media (Reynolds, 1997). Resistivity data processing was accomplished using the programing code and algorithms of a software RES2DINV. The 2D profile of resistivity was obtained by performing elimination of bad data points, topographic correction, RMS convergence restraint, least-squares inversion and a robust smoothness constraint (Loke and Barker, 1996). Inversion of resistivity was realized with suppression of the smoothness using the least square method, which adjusted the damping factor and the flatness filter ratio to adapt to different kinds of geological structures according to the quality of records (Loke, 2001).
As far as landslide investigation is concerned, ERT was applied in detecting high saturated and clay rich zones showing low resistivity (10 − 40 Ω·m) in the landslide (Lebourg et al., 2005; Naudet et al., 2008; Göktürkler et al., 2008). Electrical resistivity tomography was conducted on the profiles using the high density resistivity method. The device used in this study was a WGMD multifunction digital direct current (DC) system. All of the resistivity profiles were obtained after 8 iterations, and the RMS error in percentage at the last iteration was controlled to below 5%. Two dimensional resistivity profiles along the survey lines were produced using the Wenner configuration with 60 electrodes, 1.5m apart, to derive a detailed distribution of shallow groundwater in the debris landslide.
3.3 GPR
Ground penetrating radar emits an electromagnetic pulse into the ground by chosen antennas. The wave propagation, time-frequency and amplitude characteristics of electromagnetic signals could then be analysed in order to understand the structure of the near-surface medium (Neal, 2004). The vertical resolution of GPR is a quarter to a half of the electromagnetic wavelength, which depends on the frequency and propagation velocity of radar wave calculated from the dielectric constants of soil (Sheriff, 1991; Otto et al., 2006). A higher frequency antenna corresponds to higher resolution and shallower penetrating depth and vice versa. Therefore, the selection of antennas and layout parameters is very important in radar data collection based on the actual site conditions.
We carried out the electromagnetic surveys with ground penetrating radar SIR-20 from Geophysical Survey Systems, Inc. (GSSI) Co., Ltd. In order to assure the probing depth and resolution at the same time, a 100 MHz antenna corresponding to a theoretical penetrating depth of 15 m was selected. The sampling rate used in the tests was 250 scans/m. Generally speaking, there are three kinds of observation layout system, namely reflection profile (RP), wide angle reflection (WAR) and common midpoint (CMP). RP was used in this study to obtain radar images by moving the ground penetration radar along the above mentioned profiles with a fixed distance between the transmitting antenna and the receiving antenna. The depths in the radargram transformed from travel times were calculated based on an estimated wave velocity of  with the equation
  , where v was radar wave velocity, c was its corresponding propagation velocity in vacuum (m/s),
  was relative dielectric constants with a reference value of =8.0 given by Davis and Annan (1989). Radar data processing was accomplished using RADAN (version 6.0, Geophysical Survey Systems Inc., USA), including distance norm, range gain, finite impulse response (FIR) filter, deconvolution, Kirchhoff migration and time-depth conversion.
3.4 MSM
MSM assumes that a microtremor is a stationary random process in space and time. The shear wave velocity structure is estimated by the inversion of dispersion curves extracted from the vertical component of microtremor records by the spatial autocorrelation (SPAC) method (Aki, 1957; Okada, 2003; Xu et al., 2009). We fitted the spatial autocorrelation coefficient to obtain Rayleigh wave dispersion curves for the inversion of shear wave velocity structure (Xu et al., 2012).
The microtremor survey instrument comprised a broadband seismometer CMG-3ESPC and a data acquisition device REFTEK 72-08A from the Chinese seismic probe array center (CSPAC), mainly including a broadband seismometer, battery, GPS clock, data collector and wires, etc. The single-point circular array observation system comprised seven sets of microtremor instruments to observe digital signals simultaneously, and the synchronization was controlled by an inner GPS clock in the collector. As shown in Fig. 6a, here S 1 is the center point (survey point), and the other six points (S 2 ─S 7 ) are station points. A total of six microtremor observation points (S 2 ─S 7 ) are
equally spaced on the circumference of two circles with radius of r 1 and r 2 , respectively. The detection depth of the SPAC method was 3 to 5 times more than the observation radius (Okada, 2003). Preliminary geological survey showed that the maximum thickness of the landslide was about 60 m. Therefore, we selected an inner radius of 5 m and an outer radius of 10 m to achieve the SPAC detection depth (Fig. 6b). Finally, observation was conducted for two hours at each survey point after the instrument was stable.
4. Results and discussion
4.1 Shallow colluvial layer of the landslide
To obtain the thickness of the shallow colluvial layer (SCL) of the debris landslide, geophysical methods of MASW and GPR were jointly used to derive shear wave velocity profiles (P1, P2, and P3) and reflection profiles of the radar wave (P2, P3). The interval of surveying points was 6.0 m on all Vs profiles (Fig. 7). Location of the transverse profiles P2 and P3 were marked with thick black dashed lines on the longitudinal profile P1 as shown in Fig. 7a. Boreholes ZK02 and ZK03 were located at the bottom of the landslide. The reliable investigation depth of MASW was 15 m, which was limited by the broken characteristics of gravel soil.
According to the Vs profile of P1, the landslide geological structure was divided into 4 layers from surface to the depth of 12 m, including diluvial layer (<150 m/s), diluvial gravel layer (150−250m/s), gravel layer (250−350m/s) and gravel clay layer (350−500m/s), which was verified by the exposed geological profile in Fig. 4c. Average thickness of the shallow colluvial layer of the landslide was about 5.0 m. The thickness of upper part of the landslide was greater, about 5-13m, than that at the toe, about 3-5m. The maximum and minimum thickness were located next to P2 and P3, respectively, in accordance with the results from the boreholes ZK02 and ZK03. High velocity body (Vs>550 m/s) existed in the range of 40-50 m on Profile P1 at a depth of about 7.0m. Average thickness of the SCL on Profile P2 (Fig. 7b) was over 4.0 m. However, there was a collapsed low velocity zone (200-300 m/s) with a width of about 10.0 m at the location of about 30 m, of which the maximum thickness was about 13.0 m. By contrast, variation in thickness of the SCL on Profile P3 was relatively flat with an average thickness of about 3.0 m. Three high velocity blocks (>550 m/s) existed in the left part of P3. Meanwhile, there were two large low velocity zones (300−350 m/s) on Profile P3 at the locations of 30.0 m and 80.0 m with thickness of 8.0 m.
In order to verify the SCL results evaluated from MASW, we carried out GPR survey on Profiles P2 and P3. Strong attenuation zones delimited by thick dashed lines in Fig. 8 were in accordance with the low velocity zones (LVZ) in Fig. 7b and Fig. 7c, which showed a good consistency with each other in detecting shallow structure of the landslide. The elastic properties and conductivity of rock and soil in the landslide could be described with shear wave velocity and electromagnetic wave attenuation, respectively. MASW was relatively accurate for probing shallow subsurface with high resolution in the range of 15 m depth, and the critical shear wave velocity of the SCL in the debris landslide was 350 m/s. GPR was faster than MASW in obtaining the radar image of landslide structure based on the dielectric constants of underground materials. Moreover, collapsed zones in Fig. 7 and Fig. 8 were consistent with each other which could be interpreted with the drill core samples of ZK02 in Fig. 7. Positive amplitudes and negative amplitudes represented stiff soil and loose soil, namely, high density soil and low density soil, respectively.
However, the probing depth of both MASW and GPR was limited as a result of strong attenuation of Rayleigh surface waves and radar waves by the loose or broken gravel soil. The SCL undulation and geological anomalous bodies (large boulders or stones) revealed the limitations of drilling technology. The thickness of the SCL could be regarded as the estimation basis of slope debris flow volume (Le Roux et al., 2011), and it was closely related to the accurate location of groundwater seepage paths.
4.2 Hydrologic conditions
ERT was suitable to identify the internal structure, water rich zone, clay zone and saturated faults in landslides (Lebourg et al., 2005, 2010; Marescot et al., 2008). For the Xishan village landslide, Xu et al. (2016) investigated the preferential flow pathways in it via time-lapse electrical resistivity tomography (TLERT). To locate the groundwater flow channels in the landslide, we conducted ERT survey along four resistivity profiles (P1, P2, P3 and P4) on it. The short vertical line segments on top of each profile were electrode positions of a Wenner configuration, 1.5 m apart (Fig. 9a). The credible investigation depth of ERT was about 12.0 m. The resistivity value of landslide material was in the range of 0−300 Ω·m, out of which it was not reliable due to the interpolation in resistivity inversion (Fig. 9a). In Fig. 9a, thin black dashed lines were used to indicate the thickness of the SCL, and thick black dashed lines delineated the saturated zones or clay rich zones. White arrows showed the drainage direction of groundwater, and seepage field was visible too in the landslide.
Comparing with the profiles in Fig. 7, the resistivity value in Fig. 9was consistent with the shear wave velocity. On Profile P1, there was a low-conductivity, high-velocity block (Vs>550 m/s, ρ>300 Ω·m) and a high–conductivity, low-velocity block (Vs<350 m/s, ρ<40 Ω·m) at 45 m and 60 m away from the toe (left end) of the landslide, respectively. Similar results appeared on Profiles P2 and P3, such as a visible high-conductivity, low-velocity block at 6.0 m depth on Profiles P2 and P3 at locations of 30 m 80 m from the left end, respectively. Figs. 7, 8 and 9 from different methods gave similar variation results of the geological structure at the same locations of the Profiles P2 and P3.
The resistivity value of the high saturated zone in the debris landslide was in the range of 0−50 Ω·m. The range with resistivity over 50 Ω·m could be interpreted as a low water content zone, or a high density zone with large boulders or stones (Fig. 4b). Some different size groundwater outcrop points and drill core samples shown in Fig. 9 could provide some evidence for the above discussion. For instance, groundwater outflow in Fig. 3d was located on Profile P4 (Fig. 9) at the location of 40 m at depth of 6.0 m. The groundwater drainage system in the debris landslide was a dendritic pipe-network system showing the characteristics of great inhomogeneity and concentration.
4.3 Potential sliding surface of the landslide
The overburden thickness of the deep seated Xishan village landslide was about 50 m. An initiative source MASW and passive source MSM were used to obtain the internal structure and potential sliding surface of this landslide in view of probing depth and resolution at the same time. Investigation depth of MASW was limited in depth range of 20 m, controlled by a high frequency component (20−100 Hz) from the hammer source. Investigation depth of MSM was up to hundreds of meters for low frequency component (1−20 Hz) from microtremor (Xu et al., 2009; 2012). As shown in Fig. 10, inverse black solid triangles represent the survey points of MASW arranged at an equal spacing of 6.0 m. Gray rectangles were the survey center points O i of the microtremor observation array in Fig. 6a. The geological structure included 4 layers, including a shallow colluvial layer (90−250 m/s), gravel soil layer (250−400m/s), weathered phyllite (400−500m/s) and phyllite bedrock (>500m/s).
The potential sliding surface estimated by MSM was a weathered phyllite boundary in the range of 45-55 m at depth, and the average depth was 50 m. The location of the weathered phyllite layer determined by MSM was close to the borehole results, and the geometric shape of it was also visible on the Vs profile in Fig. 10. As far as delineation of weathered bedrock is concerned, the thickness of the weathered layer from borehole ZK03 was about 7.6 m. The strong weathered layer and intermediary weathered layer estimated from ZK03 in Fig.5 were in the range of 53.2-55.2 m and 55.2-60.8 m in depth, respectively. Meanwhile, the weathered layer estimated by MSM was in the range of 30-57 m, and the average depth was about 51.5 m corresponding to a shear wave velocity of 400−500 m/s. However, MSM failed to distinguish the strong weathered layer and intermediary weathered layer, owing to insufficient survey points on the cross profile. Ellipses represented the positions of large boulders or stones, which indicated that geophysical survey with high covering density could provide a reference for drilling site selection. Dual-source type surface wave (DDSW) could simultaneously assure both the exploration depth and resolution for the structure detection of landslides. This technology was more effective than drilling in terms of delineating depth, survey range and expenditure, and more suitable for large scale and high density survey of a debris landslide.
4.4 Hydrogeological model of the landslide
A hydrogeological model of the debris landslide shown in Fig. 11 was built based on the above joint analysis on the geological structure, hydrological conditions and potential failure surface through integrated geophysical methods. The shallow colluvial layer was surveyed with MASW and GPR. In situ hydrological information and pipe-network seepage system were extracted with ERT. The geometric shape of the deep seated weathered bedrock and potential sliding surface was delineated with MSM. Strong infiltration was visible, and potential failure surface was finally estimated by both engineering survey and MSM in this model.
The internal structure of this landslide from MASW and MSM shown in Fig. 10 could provide a reliable geological structure background for the delineation of seepage system. The gray areas in Fig. 11 represented high-velocity and low-conductivity bodies from MASW and GPR, respectively, which could be interpreted as large stones or hard blocks. The potential sliding surface estimated by MSM was more visible and accurate than that from boreholes. A collapsed low-velocity and high-conductivity block was formed by the confluence of shallow underground water in the loose colluvial layer. The development of a pipe-network seepage system in a gravel soil layer beneath the catchment area was a key factor for the stability estimation of a landslide.
At depths up to 15 m, underground water continued to infiltrate down to a deeper gravel soil layer. ERT revealed the infiltration paths marked by black solid lines with arrows, which showed the detour flow around geological abnormal zones. At depths greater than 15 m, infiltration paths marked by black dashed lines with arrows in a gravel soil layer were speculated due to the limited amount of electrodes. Therefore, longer survey lines were necessary to learn about deeper hydrological information. It was known that the pipe-network seepage system in landslides could drain underground water away in time to maintain the stability of them. Our study attempted to discover the developing characteristics of seepage paths in a shallow debris landslide, but deeper vertical infiltrability was unknown.
To verify the geophysical results, some geotechnical techniques and corresponding parameters were recently used in geophysical interpretation, such as the combined penetrometer moisture probe (CPMP), resistivity cone (RCPTU), penetration resistance, remoulded shear strength, and so on (Yamakawa et al. 2010; Hibert et al. 2012; Solberg et al.,2016). Continuous pore water pressure monitoring via borehole ZK03 using BGK-4500SR osmometers showed that pore water pressure at depth of 25.92 m was high and increased with time, which meant that this location was on the pipe-network seepage paths. By contrast, the pore water pressure was about 7~17 kPa at depths of 8.00 m and 48.12 m and the variation with time was not obvious. These verified the pipe-network seepage system revealed by integrated geophysical investigation.
Fig. 13 gives the relationship between shear wave velocity and pore water pressure and displacement. The observed displacements using borehole inclinometers in Fig.13 gradually decreased with increase in depth from 5.39 m to 48.32 m. It also illustrated that the infiltration of groundwater had induced the landslide deformation. The depth of potential infiltration interface might be in the depth range of 25~30 m as indicated by Figs. 11 and 13. The corresponding shear wave velocity was about 400 m/s. The depth of potential sliding surface estimated from the displacement observation was about 38.48 m, which was consistent with the boundary for the weathered phyllite in Fig. 11. There was an obvious negative correlation between shear wave velocity and displacement along depth in Fig. 13, which indicated that the activities of landslide could be inferred by geophysical methods. The shear strength of the potential sliding surface would decrease if groundwater infiltrated into the weathered phyllite layer. Further survey work should be conducted to confirm this. More complimentary in situ and laboratory tests were necessary to evaluate mechanical and hydrogeological parameters of the landslide subsoil from geophysical investigation. The comprehensive application of geophysical and geotechnical techniques will be able to determine the quantitative hydro-geological characteristics of debris landslides in the future.
5. Conclusion
In this study, surveys with multi-geophysical methods were carried out on a debris landslide in Xishan Village, Li County, Sichuan Province, China. Shear wave velocity (Vs) could provide some information about stratum structure, geological abnormal body (large boulders or blocks), fissures and deformation of the landslide, etc. Resistivity value (ρ) was used to detect variation in water content, high saturated and clay rich zones. Electromagnetic wave attenuation was very helpful for the tomography of shallow structures with high resolution, especially for saturated or clay rich zones. The depth and geometry of shallow colluvial layers was revealed by the combined application of MASW and GPR. ERT was an effective tool to probe hydrographic information and seepage paths in the debris landslide. The combination of MASW and MSM was the most suitable to delineate the internal structure, bedrock, weathered bedrock layer and potential sliding surface of the deep seated landslide.
Varisized boulders and stones in the debris landslide have significant influence on the location selection of boreholes, so that preliminary geophysical surveys are particularly important. Geophysical investigation showed that dendritic pipe-network seepage paths with different dimensions developed in the slope. Groundwater seepage was highly inhomogeneous and concentrated in the debris landslide. Water infiltration in landslides directly affects their stability, so that surface and underground water drainage is an important measure for debris landslide mitigation. The combined application of geophysical technologies were very useful for in situ identification of groundwater infiltration paths in the debris landslide. It could provide a reference for the location selection of drainage ditches or flumes.
Photos:
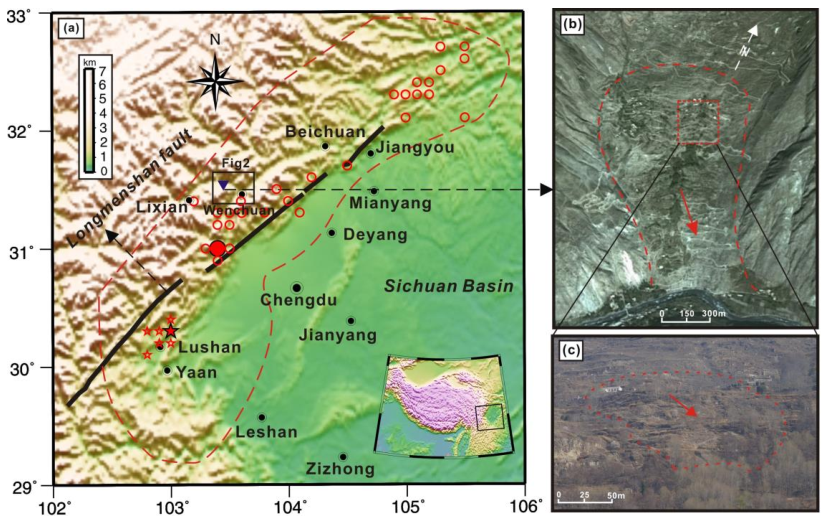
Fig. 1. (a) Location of the study area. The red circles and stars represent locations of the Wenchuan earthquake and
the Lushan earthquake, respectively. The red dashed line is the seismic intensity distribution range of both
earthquakes. (b) The Xishan village landslide. The red arrows indicate the main sliding direction of the landslide.
(c) Testing landslide site. The red dashed line is the boundary of a small landslide on the Xinshan village landslide.
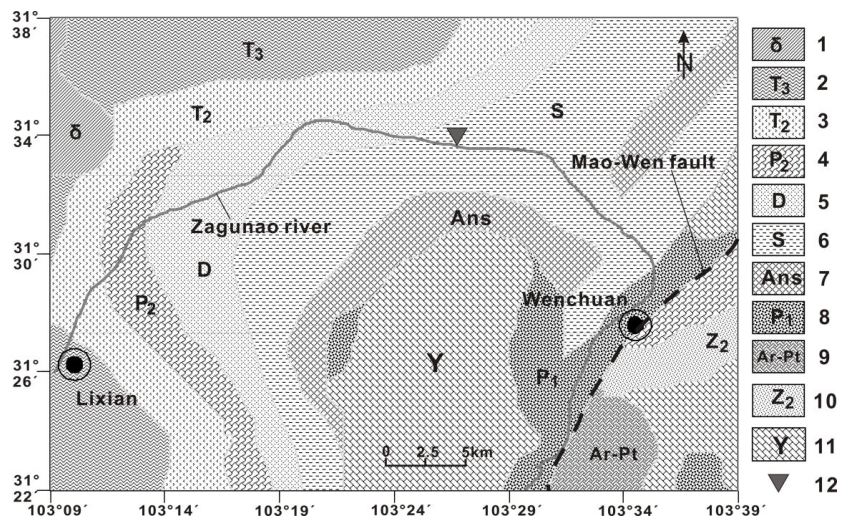
Fig. 2. Regional geological map of the study area.
(1) Quartz syenite rock; (2) Clasolite and carbonate ; (3) Fine clasolite and carbonate; (4) Sandstone and limestone;
(5) Limestone and mudstone; (6) Slate and phyllite; (7) Silurian System ; (8) Siltstone, limestone and extrusive
rock; (9) Kangding Gr; (10) Dolomite and sand shale; (11) Plagioclase granite ; (12) Xishan village landslide.
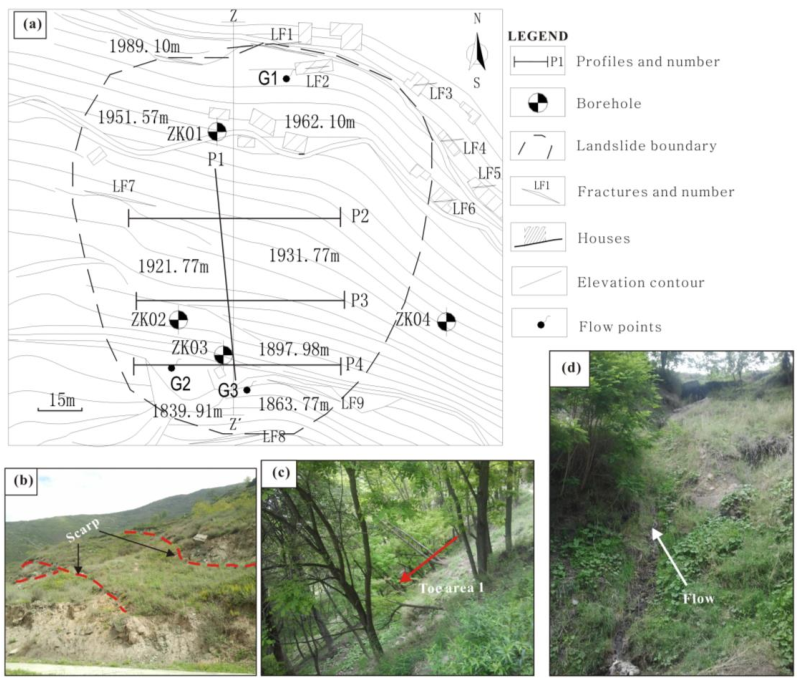
Fig. 3. (a) Map of the engineering geological plane; (b) Scarps at the back edge of the landslide; (c, d) Vegetation
coverage and water outflow at the toe of the landslide (G3).
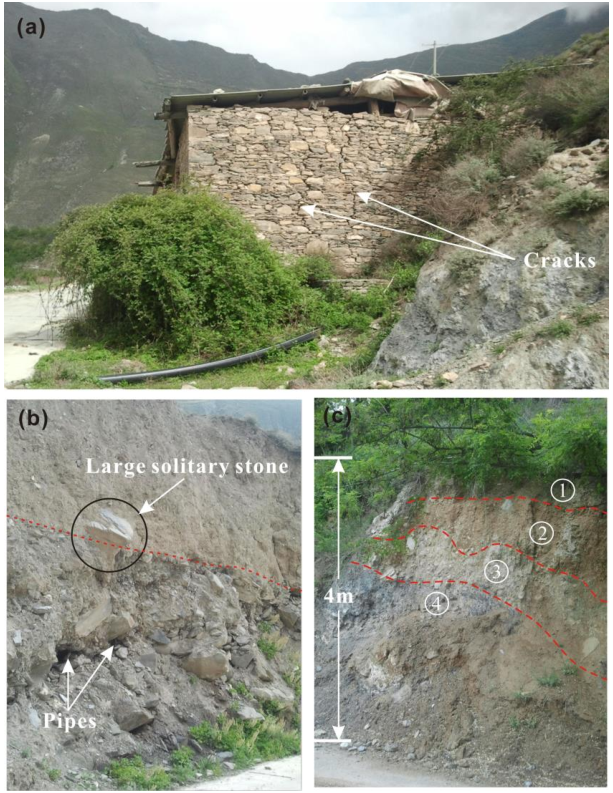
Fig. 4. (a) House cracks induced by landslide deformation; (b) Excavation profile near the rural road; (c) Shallow
stratum on the landslide located near the flow point G2 and G3 in Fig. 3a.
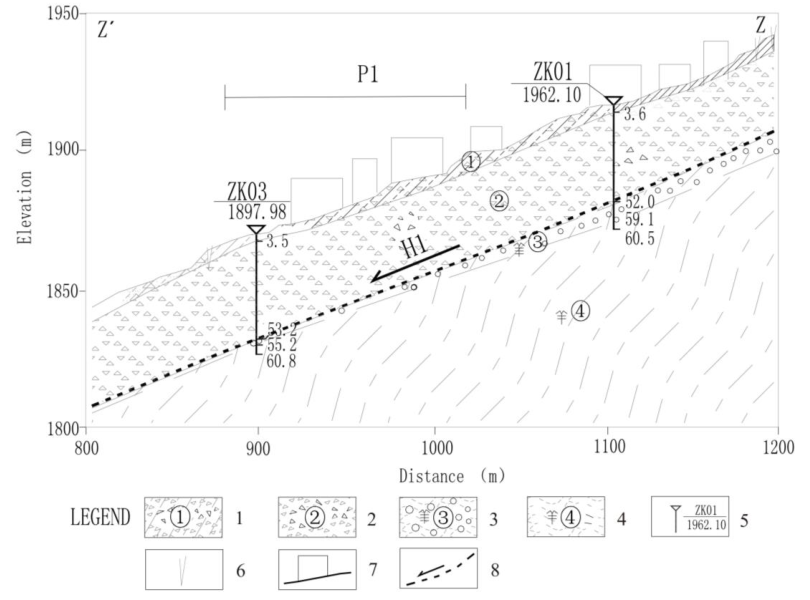
Fig. 5. Cross-section (ZZ') showing the structure of landslide in Fig. 3a.
(1) Quaternary diluvium; (2) Gravel soil; (3) Weathered phyllite; (4) Phyllite bedrock; (5) Borehole and number; (6)
Fissure; (7) House; (8) Potential failure surface.
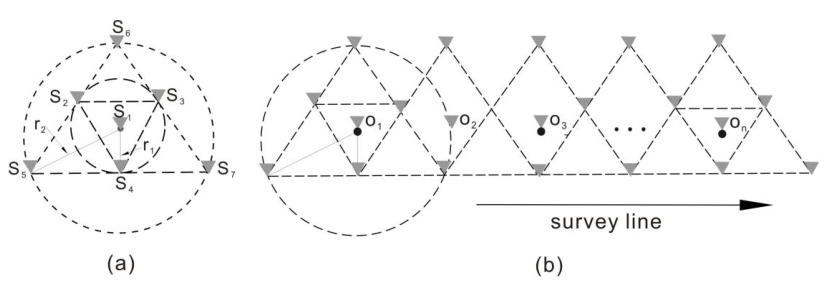
Fig. 6. Layout of microtremor observation array.
(a) Single-point array survey system; (b) Layout of microtremor profile observation.
The black solid circles represent survey points; gray solid inverse triangles indicate the locations of observation
equipment.
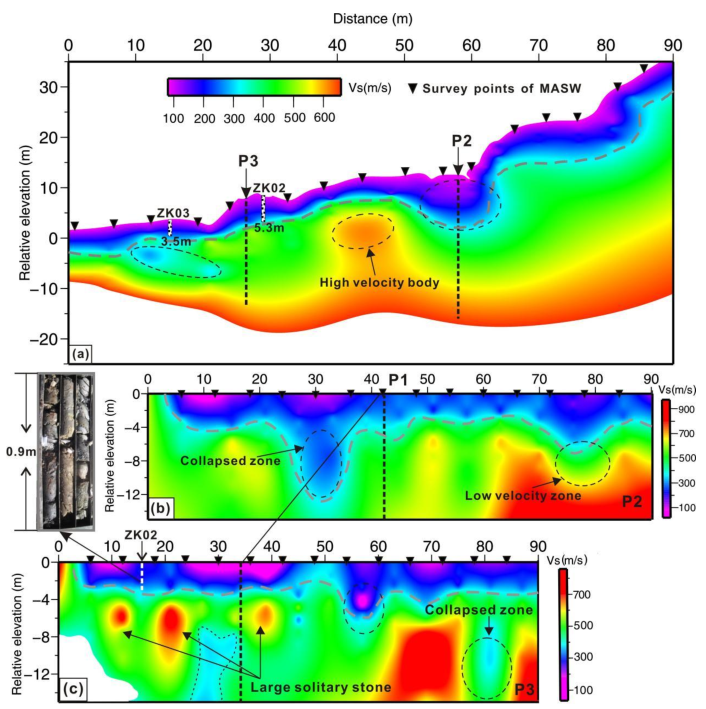
Fig. 7. The profiles of shear wave velocity in landslide.
(a) Profile P1; (b) Profile P2; (c) Profile P3.
The black inverse triangles represent survey points, black dashed lines represent the location of profiles and
gray dashed lines indicate the depth distribution of the shallow colluvial layer (SCL)
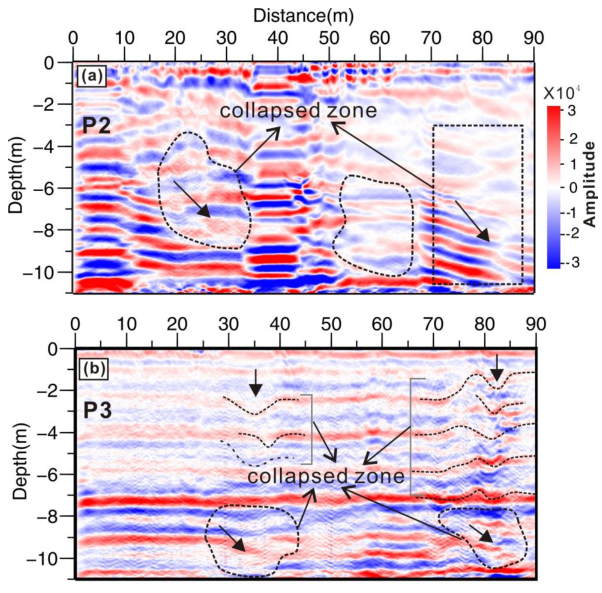
Fig. 8. GPR image profiles of P2 and P3.
The arrows indicate the extension direction of collapsed zones; radar wave attenuation zones were delimited by
thick dashed lines which corresponded well to the location of collapsed zones or low velocity zones (LVZ) of the
Vs profiles on P2 and P3 in Fig. 3.
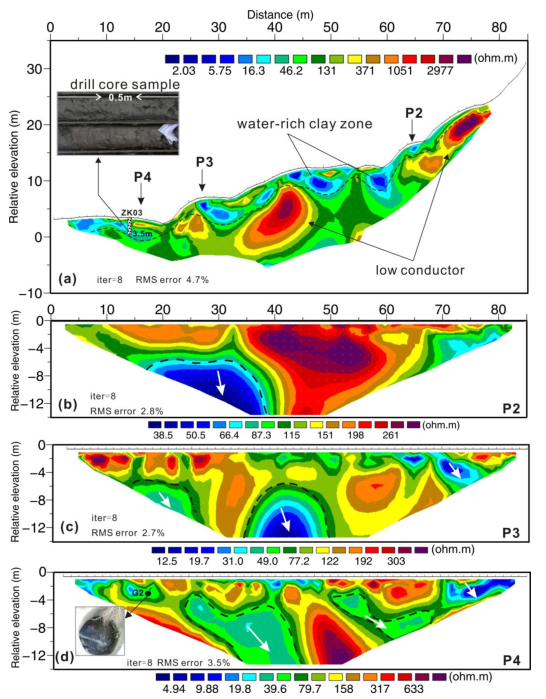
Fig. 9. Electrical resistivity tomography (ERT) profiles.
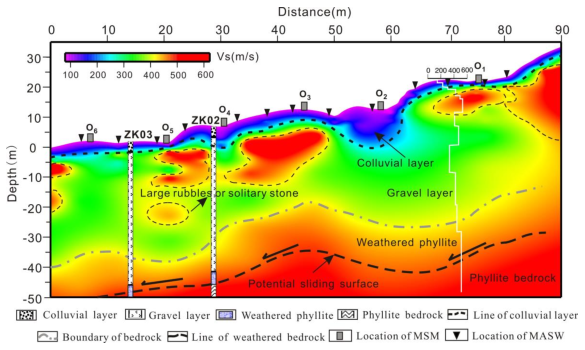
Fig. 10. Shear velocity structure estimated by both the MASW and MSM
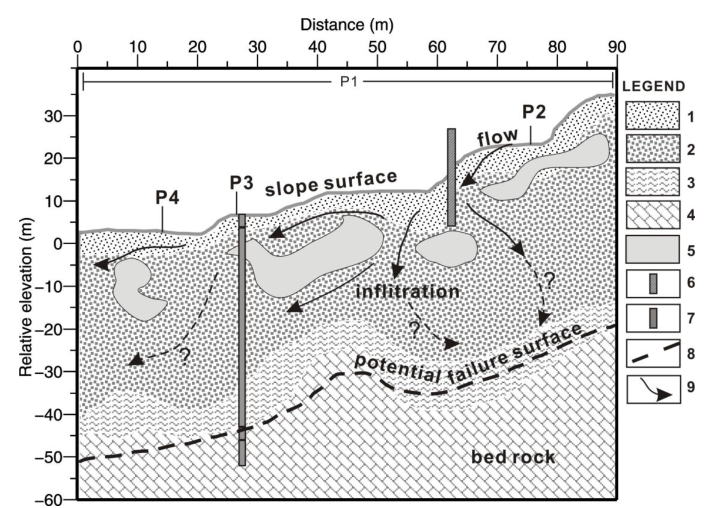
Fig. 11. A Hydro-geology model of comprehensive interpretation in the debris landslide.
(1) Diluvium layer; (2) Gravel layer; (3) Strong weathered phyllite; (4) Phyllite bedrock; (5) High velocity or low
conductor zone; (6) Drainage channel ; (7) Borehole; (8) Potential failure surface comprehensive assessment from
geophysical investigation and engineering survey ; (9) Infiltration paths of surface water.
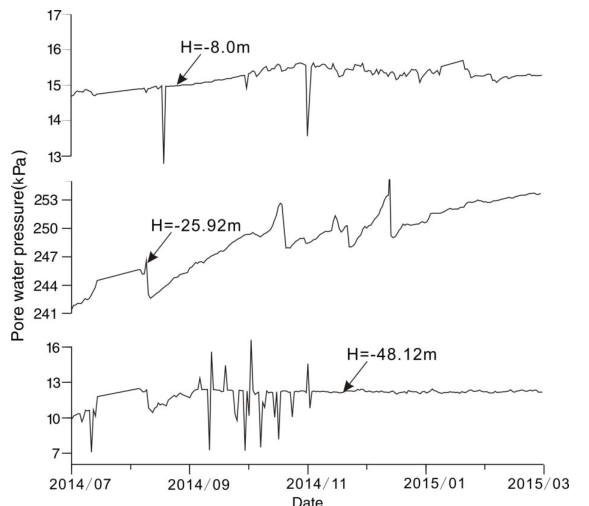
Fig. 12. The monitored pore water pressure at 8.0 m, 25.92 m and 48.12 m depth of ZK03
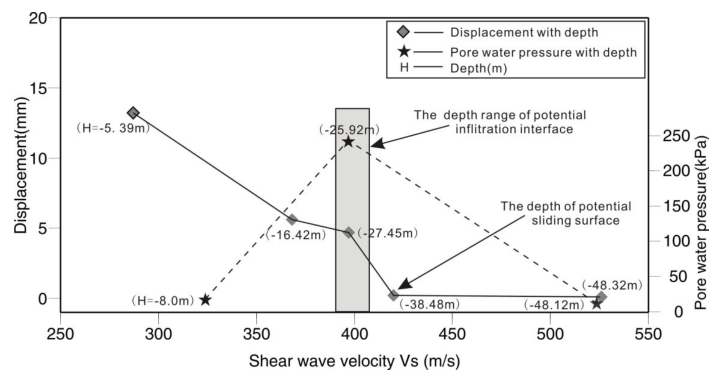
Fig. 13. The relationship between shear wave velocity and pore water pressure and displacements along the depth
of ZK03 in the landslide
 ENGLISH
 Chinese
 Russian

