Integrated Geophysical Methods for Underground Water Invesitgation of a Karst Area
Abstract
Because of heterogeneity and anisotropy, it is very difficult to optimize groundwater exploration drilling locations in karst areas using only hydrogeological information. However, the integrated application of the audio frequency telluric method and electrical resistivity tomography has proved to be efficient for groundwater exploration in karst areas with or without thin cover. In the case studies presented here, audio frequency telluric profiling is used to roughly determine the location and strike of a karsted or fractured zone where the cover thickness is less than 30 m, then an electrical resistivity profile perpendicular to the strike of the zone is designed to reconstruct the resistivity structure with a Schlumberger array. By combining the geophysical results with available hydrogeological data, an optimal drilling site can be established. This integrated geophysical approach for karst water exploration has been used in several projects and the results show that the method is reasonable and useful.
Introduction
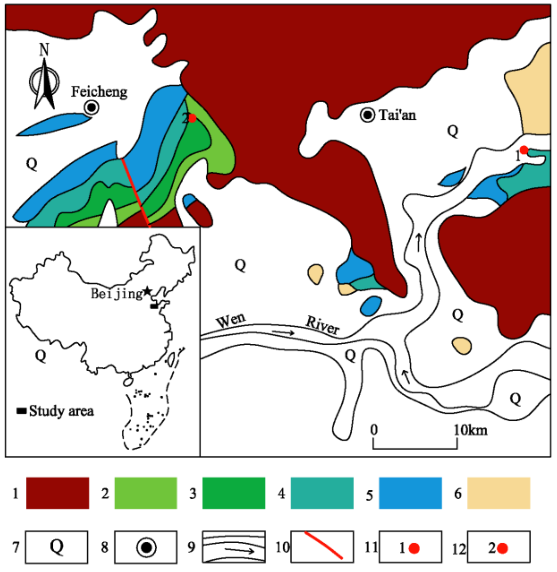
Since 2009, extreme climate events, persistent drought and low rainfall, has made drinking water scarce for human consumption and agricultural purposes in some parts of China, especially in karst regions. At the beginning of 2012, a groundwater exploration team was constituted by the Institute of Karst Geology to support drought disaster relief. The team traveled to Tai'an city, Shandong Province, in the east of China (Figure 1) to search for promising exploratory sites for karst water using hydrogeological investigations and geophysical prospecting. Within a month, 23 exploratory wells were optimally positioned and drilled. Subsequently, 21 were tested by pumping, and produced an abundance of water.
Figure 1. Location and geological map of the project area in Tai’an City, Shandong Province, China 1. Granite, 2-4. Limestone (1, 2, and 3), 5. Dolomite and Limestone (O1) 6. Sandstone and breccia (E), 7. Quaternary, 8. Tai’an City, 9. Wen River, 10. Fault, 11. Guanlu, 12. Momoshan.
Because of the highly non-uniform development of karst environments, suitable geophysical methods needed to be selected to identify water-bearing structures such as water-filled caves or water-filled fissures underground. Recently, the audio frequency telluric method (AFTM) has been successfully employed to detect water in karst settings (Chen, 1988; CGS 2005; Gan, 2011), and to probe fissures of water in combination with the induced polarization (IP) method (Li, 2009). The typical advantages of this method are that they are both rapid and cost-effective; however, this is countered by disadvantages, including a shallow investigation depth and a lack of anomaly variations with depth. Electrical resistivity tomography (ERT) can be applied to define the water table (Zaidi, 2012), to delineate aquifers (Kumar, 2012), to search for karst geological structures (Leuccim, 2005) and find karst water (Metwaly, 2012; Vlahović, 2011) using characteristics of the resistivity variation with depth. Compared with using a single geophysical method alone, the integrated approach usually provides more reliable information, and as a result has been widely applied for groundwater investigations. Alexopoulos (2011) employed both the very low frequency (VLF) electromagnetic method and ERT to map water pathways. Vargemezis (2011) even carried out VLF, Self-Potential (SP) and ERT surveys together to optimize locations for the construction of hydro wells.
Two examples presented here to trace karst water show that the AFTM and the ERT methods have the advantages of saving time and increasing efficiency.
Geophysical methods
Audio frequency telluric method (AFTM)
This method, which takes advantage of natural telluric current variations with frequencies induced in the earth by phenomena such as solar emission and thunderstorms, detects conductive difference distributions underground and interprets them in terms of geology or hydrogeology.
The AFTM is a preferred method for rapid ground reconnaissance and shallow exploration where overburden thickness is usually less than 30 m, It is conducted in situ to determine potential gradient measurements along a line, which is usually set up perpendicular to the strike of geological structures. The equipment used to measure the potential gradients was a Model YDD-B unit, with frequency range of 20 Hz to 25 kHz, manufactured by the Center for Hydrogeology and Environmental Geology Surveying. Measurement stations were usually 10 m apart. Because telluric currents change with time, the potential gradient between two electrodes, induced by a telluric current field, is unstable. Thus the profile measurements needed to be collected as quickly as possible in the field (generally within an hour). In the end, the potential gradient was plotted against the midpoint of the potential electrodes. This method is often used to map shallow subsurface karst features showing relatively low potential values if they are water-filled.
Electric Resistivity Tomography (ERT)
For the ERT survey, a 60-channel unit, WDJD-3+WDZJ-3 (manufactured by BTSK/LANGEO, China), in a multi-electrode configuration, was used.
Apparent resistivity data were collected and stored automatically using 60 electrodes with a 10 m spacing. A Schlumberger electrode configuration was selected because of its suitability for the study of horizontal and vertical structures.
The results are produced using Res2dinv software, which first creates an underground resistivity model and then calculates resistivity and depth values for geological structures detected along the profile. The maximum investigation depth mainly depends on the total length of the spread.
Case study 1
Geological setting
The survey site at 36°08′12″N, 117°18′05″E is located at Guanlu village, about 20 km east of Tai’an City in Shangdong Province, China. The widely distributed overburden in the region, with a thickness of about 10 m, consists of Quaternary deposits of sand and gravel. The underlying karst water-bearing rock groups, with beds dipping N25°W at an angle of 7°, consist of Gushan Fm. (Є3g) (upper Cambrian) limestone and thin- to thick- bedded limestone or argillaceous limestone embedded within the shale of the Zhangxia Fm. (Є2z) (middle Cambrian), as shown in Figure 2.
The terrain in the study area is flat. The Wen River, flowing eastward about 600 m to the north, coincides with the lowest drainage datum plane. Groundwater moves from south to north following two discharge mechanisms. The first involves groundwater moving along rock layers with scattering discharge as a result of the shallow incision of the valley, the low hydraulic gradient of groundwater,
and the wide areal distribution of the groundwater. The second involves abundant volumes of groundwater moving within karst fissures with centralized discharge. The condition of the landforms favors groundwater accumulation. The majority of the karst areas in the south provide stable sources of groundwater supply. However, one disadvantage is that contaminated water may intrude into the system from the Wen River as a result of the extraction of karst groundwater.
Regional tectonic structures trend from northwest to southeast. Those structures, influenced tectonically and formed locally, are targeted as karst water reservoirs. A hydrogeological map shows their distribution in Figure 2.
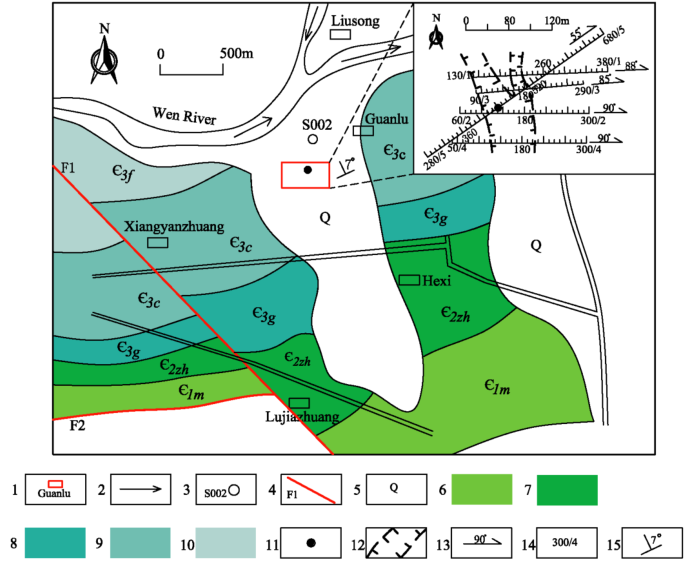
Figure 2. Hydrogeological map of survey site and geophysical profiles (1. Survey site, 2. Surface water direction, 3. Drill hole, 4. Fault, 5. Quaternary, 6-10. Cambrian Limestone, 11. Recommended borehole, 12. Fracture zone, 13. Profile direction, 14. Station/profile No., 15. Dip direction and dip).
Geophysical methods
The five geophysical survey lines shown in Figure 2 were mainly set up perpendicular to water-bearing
structures that are oriented south-north or northwest- southeast. The AFTM was first used to detect the horizontal trend of zones of lower potential and then the ERT method was used to vertically probe lower resistivity variations with depth.
The potential curve of the AFTM for line 5 in Figure 3 shows a clear lower potential anomaly at stations 350- 470, possibly indicating the existence of karst fissures somewhere underground.
In the end, the regions of lowest potential from all profiles in the AFTM could be identified (see Figure 3), for example, stations 130/1-170/1, 200/1-220/1, 90/3- 150/3, 160/3-190/3, 95/2-205/2 and 120/4-200/4. The two main branches of the low potential anomalies in lines 1 and 3 extend southward and meet at lines 2 and 5, showing a Y-like shape that is narrow in the north and wide in the south. These lower potential anomaly zones, because of their wider distribution, are inferred to be karst fissures with an abundance of water.
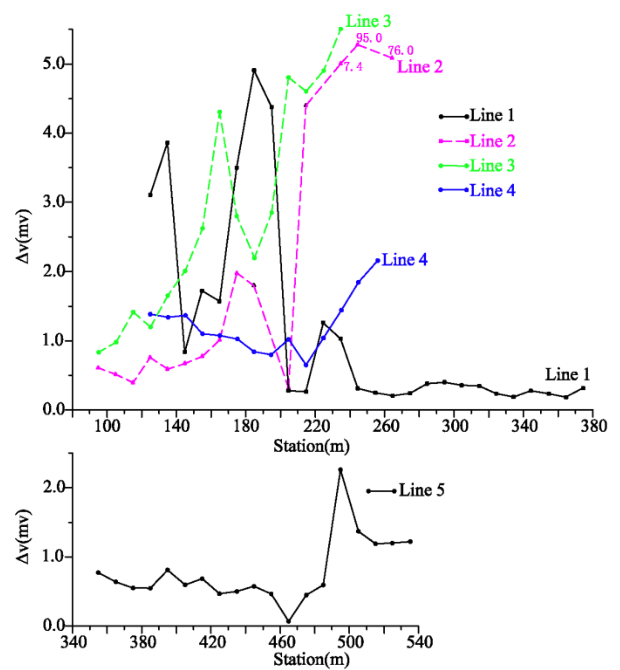
Figure 3. Potential curves of the AFTM for lines 1,2, 3, 4 and 5.
Subsequently, the ERT line was set up along the strike of the lower potential anomaly. In Figure 4 , Schlumberger array apparent resistivity contours, taken from the ERT for line 5, show a clear contact between lower and higher resistivity zones at station 500/5. In particular, the striped low resistivity zone between stations 380/5 and 500/5 reveals vertical karst fissures.
The stratigraphy of the proposed drill hole at station 440/5 in Figure 4 (lower) was predicted from the Schlumberger resistivity section in the ERT to consist of a subsoil of alluvial clay, sand and gravel that is about 26 m thick. Karst fissures and caves were interpreted at depth ranges 26 – 70 m and 90 – 110 m, respectively.
These predictions were tested by hammer drilling. The resulting well is 150 m deep, with a static water level 10 m below the surface. The first cave appeared at a depth of 32 m. Hammer drilling was difficult due to the highly fractured nature of the rock that caused the pipe to stick often. After pumping tests, the pumping capacity was set at 480 m 3 /d with a maximum drawdown of 20 m .
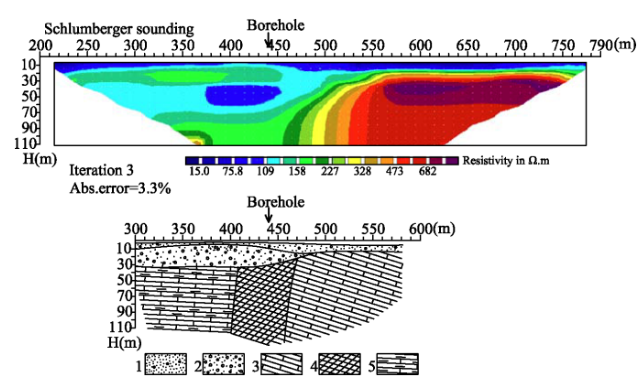
Figure 4. Resistivity imaging (upper), Geological interpretation for profile 5 (lower) 1. Fine sand with gravel, 2.
Gravel with fine sand, 3. Limestone, 4. Karst fissures, 5. Interbedded limestone and shale.
Case study 2
Geological setting
The study site at 36°09′31″N, 116°53′02″E is located at Momoshan village, approximately 20 km west of Tai’an City. The region is characterized by cone karst and valley topography. The maximum elevation difference in the region is about 150 m and the valley is about 300 m wide. Geophysical survey lines, positioned with only small changes in elevation, are located across a hill slope showing bare karst rocks. The overburden thickness varies from 0-5 m, and has a monoclinal structure with beds dipping N20°W at angles of 10° to 20°. The underlying rocks are thin argillaceous limestones or edgewise limestones embedded with thin shale (upper Cambrian). Karst fissures, 0.1-2 cm wide and up to 2 m long, are widely distributed on the ground surface. Groundwater moves from north to south in a direction that is nearly opposite to the dip direction of the beds. A map of the hydrogeology is shown in Figure 5.
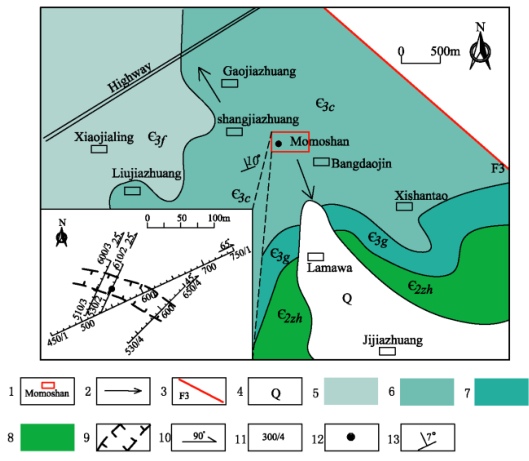
Figure 5. Hydrogeological map of the survey site and geophysical profiles 1. Survey site, 2. Surface water direction, 3. Fault, 4. Quaternary, 5-8. Cambrian Limestone, 9. Fissure zone, 10. Survey line direction, 11. Station/ Line No., 12. Recommended borehole, 13. Dip direction and dip
Hydrological conditions, including a deep water table at a depth of about 100 m and the location of the survey on the southern side of the watershed, make it difficult to search for groundwater resources. Since 1949, three dry wells have been drilled nearby. From a landform perspective, high in the north and low in the south, it is likely that groundwater in this region moves southward along karst fracture zones in a concentrated flow regime. Therefore, appropriate geophysical methods can be chosen to outline these favorable zones.
Geophysical methods
As before, the AFTM was first conducted to roughly constrain the position and orientation of groundwater runoff zones, then the ERT method was applied to develop information on the water table and karstification level. The geophysical field setup is illustrated in Figure 5. The zone of lower potential anomaly is about 30 m wide, extending from the northwest to the southeast as constrained by lines 2, 3 and 4 in the AFTM (see Figure 6). Because of site limitations, only one ERT line could be arranged striking N65°E. Schlumberger array resistivity contours in Figure 7 (upper) readily show the lower resistivity anomalies (less than 300 Ωm) extending over a width of about 30 m and in a vertical band between stations 560/1 and 620/1.
Regions of lower resistivity determined by the integrated geophysical methods, and striking approximately 110°, were inferred to be karst fissures that could constitute favorable well positions. Because of site limitations, the testing drill hole was moved to station 570/2 based on the similar characteristics of the anomaly there.
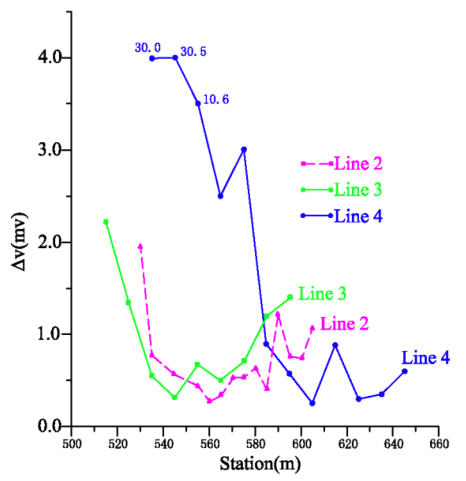
Figure 6. Potential curves of the AFTM for lines 2,3, and 4.
The well depth is 190 m with a static water level at a depth of about 80 m. After pumping tests, the yield was determined to be 280 m 3 /d with a maximum drawdown of 40 m. The flow comes mainly from units at depths of about 127 and 161 m.
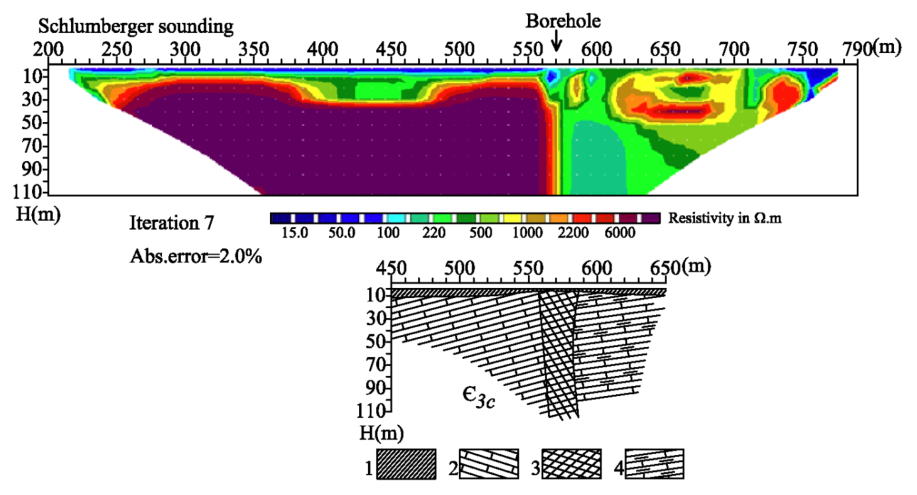
Figure 7. Resistivity imaging (upper), Geological interpretation for line 1 (lower) 1. Clay, 2. Limestone, 3. Karst
fissures, 4. Interbedded limestone and shale.
Conclusions
Many projects involving the search for groundwater in karst areas – with or without thin cover (< 30 m) – have shown that an integration of AFTM and ERT to optimize data acquisition and provide crosschecks can produce promising results. Fieldwork procedures usually consist of the following steps.
1. First, more than three AFTM profiles are collected – primarily to roughly establish the strike of karst fractures or rapidly define the contact between non-soluble and soluble rock that may focus karst development and result in favorable drilling locations. However, accurate depth estimates are not generally possible with this procedure alone.
2. Second, to constrain the geometry of horizontal and vertical geological structures, ERT data with a Schlumberger array configuration are collected. In the survey, profiles are aligned perpendicular to the previously identified low potential anomalies, thereby enabling the detailed interpretation of karst geological structures by using information about resistivity variations with depth. For a Schlumberger array consisting of 60 electrodes spaced at 10 m, the maximum depth of penetration is about 150 m.
The two methods taken together constrain lower potentials distributed horizontally (along strike) and similar changes in resistivity varying vertically. When combined with hydrogeological information, this procedure provides important and effective geophysical indications of the geological setting, and enables the optimal determination of well positions.
 ENGLISH
 Chinese
 Russian

