Ground Deformations Observed After Earthquake in Turkey
ABSTRACT
A destructive earthquake with a moment magnitude of 7.2 occurred in the north of the Van province (Turkey) on 23 rd October 2011 at 13:41 local time and caused approximately 600 deaths and more than 4000 injuries. Many damaging aftershocks were recorded for more than a month after the main shock including a triggered earthquake (M w 5.6) located in the southern district of Van, namely Edremit, on November 9 th , 2011 which caused additional damage and casualties. After the M w 7.2 Van earthquake, earthquake- induced ground deformations such as liquefaction and lateral spreading were extensively observed around the shores of Lake Van and in the floodplains of rivers. The Karasu River floodplain, which is one of the major streams in the region, severely suffered from liquefaction and lateral spreading. In this study, a brief overview of the M w 7.2 Van earthquake as well as earthquake-induced ground deformations is presented. Then, the results of field reconnaissance on liquefaction and lateral spreading features observed in the Karasu River floodplain are explained. Furthermore, subsurface characteristics of liquefied layers are documented considering the data obtained from a borehole drilled just on top of the sand boil after the earthquake. The borehole data indicate that the liquefaction occurred in a sandy zone with very shallow groundwater level in the Karasu River floodplain.
INTRODUCTION
The Van province of eastern Turkey was shaken by a shallow focus (5 km) devastating earthquake with a moment magnitude of 7.2 on 23 rd of October 2011 at 13:41 local time. The main shock adversely affected the city center and particularly Ercis district located on the northern shore of Lake Van at a distance of about 35 km to the north of the source fault. Numerous residential, official and commercial buildings were heavily damaged or collapsed in Ercis whereas the Van city center suffered less damage. The number of casualties after the earthquake reached about 600 people and more than 4000 were seriously injured (DEMP, 2011). The epicenter of the earthquake was reported as approximately 30 km north of the city center at Tabanli village by Bogazici University Kandilli Observatory and Earthquake Research Institute (KOERI, 2011) (Figure 1). Furthermore, a triggered earthquake with a magnitude of M w 5.6 hit the city of Van once more on November 9, 2011 at 21:23 local time. The epicenter of the second earthquake associated with a different fault was reported to be the southern district of the city, namely Edremit, where is about 15 km away from the center of Van (Figure 1).
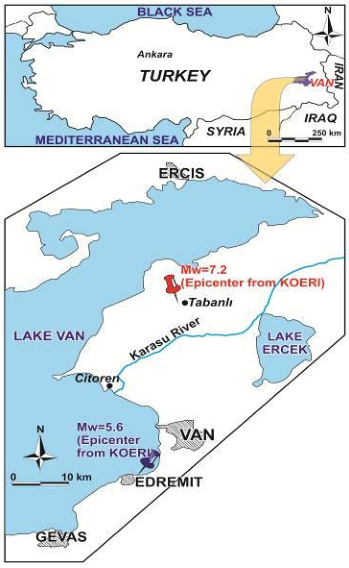
Fig. 1. Location map of the epicenter of the October 23, 2011 M w 7.2 Van earthquake
The causative fault that ruptured during the M w 7.2 Van earthquake is located about 10 km to the north of the city center (Figure 2). No significant surface rupture was observed during the field studies carried out by the authors or other investigators just after the earthquake. However, small scale traces of compressional deformations up to 5-10 cm were measured at several locations along the fault line especially in brittle structures (Figure 3). The signs of compressional deformations point out a thrust fault with the upper plate thrusting southward. The city center of Van is placed on the footwall side of the thrust fault whilst heavily damaged Ercis district is on the hanging wall side. The fault ruptured during the Van earthquake is classified as a blind fault since no obvious sign of surface rupture presents (Alan et al., 2011, Ozkaymak et al., 2011). A fault is identified as a blind fault when the rupture does not reach all the way up to the ground surface and so no clear evidence of fault rupture can be observed (Groshong, 1999; Gates and Ritchie, 2007).
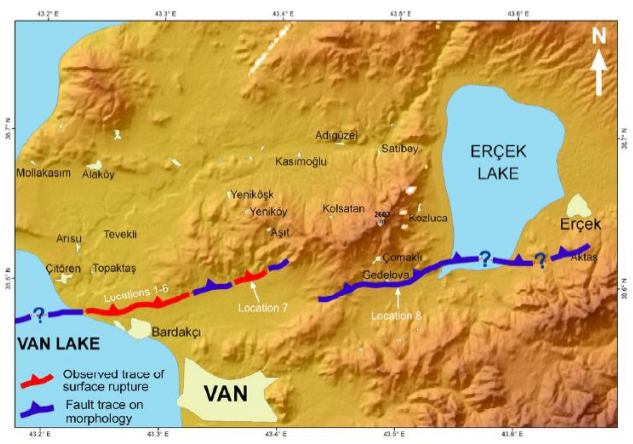
Fig. 2. Trace of the causative fault ruptured during M w 7.2
Van earthquake (Akyuz et al., 2011)
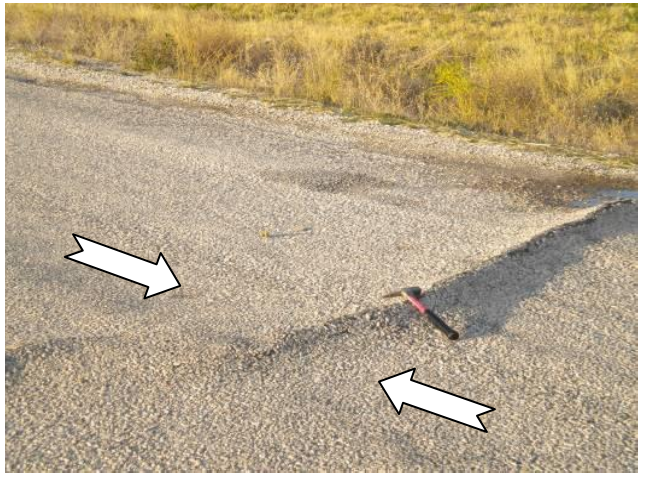
Fig. 3. Trace of compressional deformation on secondary
asphalt road
EARTHQUAKE-INDUCED GROUND DEFORMATIONS
Earthquake-induced ground deformations were extensive in many regions around the eastern and northeastern shores of the Lake Van after the M w 7.2 Van earthquake. Fortunately, no serious ground deformation-related building damages and collapses were officially reported around the earthquake affected zone except small scale damages in one-story masonry buildings and infrastructural transition lines. Liquefaction and lateral spreading were apparent at many locations, particularly in the floodplains of rivers and streams as well as in the recent deposits nearby the Lake Van. Celebibagi and Kasimbagi villages in Ercis district and the Karasu River floodplain severely suffered from ground deformations associated with liquefaction and lateral spreading. Numerous sand boils and lateral spread cracks with varying dimensions were observed around these settlements and along the embankments of the Karasu River (Figure 4). Furthermore, a large scale seismically-induced landslide near Citoren village was initiated after the earthquake blocking the Karasu river bed (Figure 5). No liquefaction or lateral spread- related features occurred in older deposits than recent alluvium during the Van earthquake.
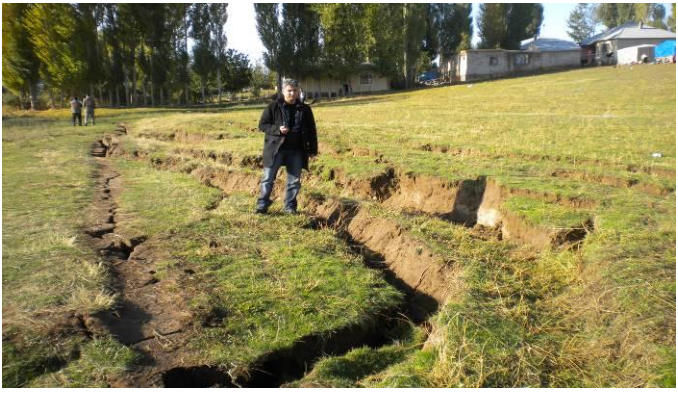
Fig. 4. Lateral spreading cracks in Celebibagi village (Ercis) affecting one-story masonry buildings at the background
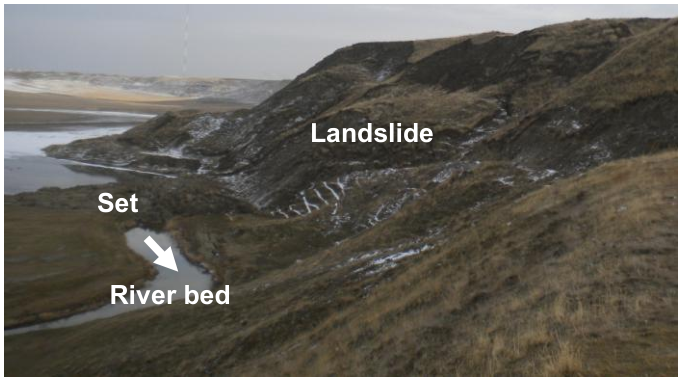
Fig. 5. Seismically-induced landslide near Citoren blocking the Karasu river bed
LIQUEFACTION AND LATERAL SPREADING IN KARASU RIVER FLOODPLAIN
The Karasu River alluvium consists of clay, silt, poorly graded sand and fine gravel. The groundwater level is very shallow (<1 m) in the floodplain deposits. The slopes adjacent to the Karasu River alluvium comprise of Late Pleistocene lacustrine deposits. This sedimentary unit is made up of thinly laminated grayish-brownish mudstone and siltstone alternations. The local community in Citoren and Topaktas villages stated that significant amount of water and sand ejected just after the earthquake for a period of more than half an hour in the floodplain of the Karasu River.
Scattered sand boils with different dimensions were observed after the earthquake in that area. Large scale sand boils with an irregular cone-shaped geometry attained a maximum width and length value of 5 m and 10 m, respectively (Figure 6). Furthermore, longer (>10 m) linear sand boils were also determined by other investigators in different regions of the Karasu River embankment (Ozkaymak et al., 2011).
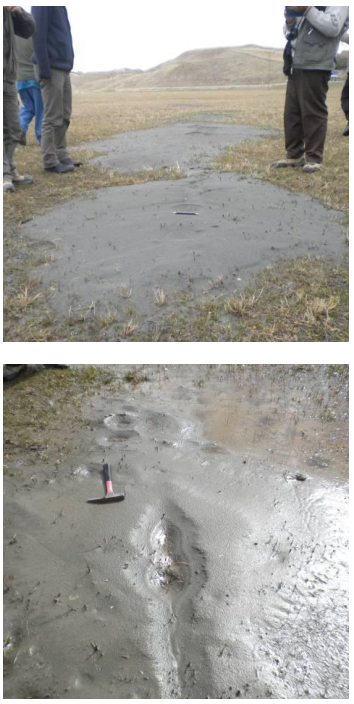
Fig. 6. Sand boils observed after the M w 7.2 Van earthquake in the Karasu River floodplain near Topaktas village
In addition to liquefaction, lateral spreading were also extensive in the same region. In several locations, lateral spreading was accompanied by sand boils. According to the field observations, lateral spreading cracks were parallel to the river bed. The general trend of lateral spreading in the research area was N50W. A maximum of 50 cm separation was measured for one crack whereas a total separation of 70 cm on two parallel ground cracks was noted. The lateral spreading crack reached as deep as 65 cm at several locations (Figure 7). Shallower (<20 cm) ground cracks were also noticed. Lateral spreading was quite persistent (generally >10 m) and a maximum of 30 m persistence was measured in the investigated floodplain.
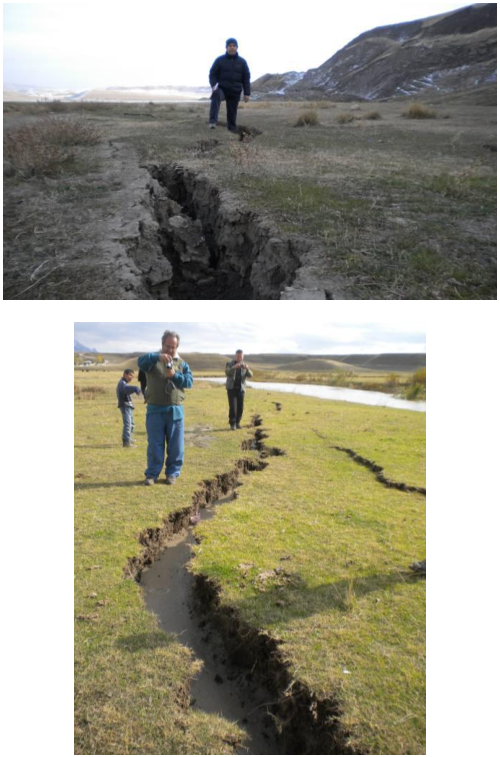
Fig. 7. Lateral spreading cracks observed after the M w 7.2 Van earthquake in the Karasu River floodplain
SUBSURFACE CHARACTERISTICS OF THE LIQUEFIED LAYERS
The subsurface characteristics of the liquefied layers in the Karasu River embankment were investigated by excavating trial pits, drilling a borehole adjacent to the sand boil and performing seismic survey on the liquefied zone. Initially, three trial pits were excavated at different sand boil locations in the perpendicular direction to the fissure zone to observe the liquefied layers and sand pipes. The pipe in where the liquefied soil rose up and the sand boil on the surface can be seen in Figure 8.
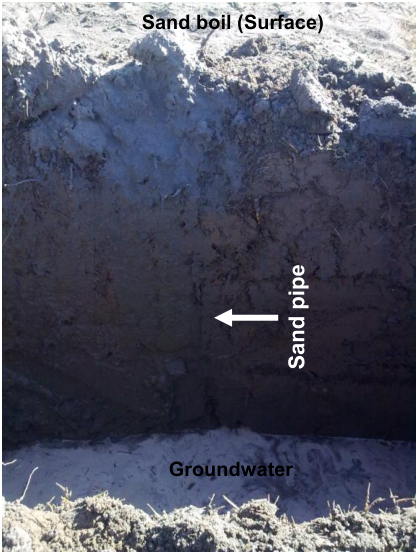
Fig. 8. Cross-sectional view of trial pit excavated on a sand boil
The thickness of clayey cap soil in the investigated area is around 2 meters considering the trial pit data. Although the groundwater level is about 2 m in Figure 8 and was deeper when the pit was first excavated, all pits were filled with water in a short time span and finally the groundwater table (GWT) rose to 40 cm below the surface. Below plastic cap soil, non- plastic, fine-grained loose sandy material which was possibly transported to the surface during liquefaction exists.
In order to observe the soil profile in the liquefaction zone and to determine the geotechnical properties of the liquefied and non-liquefied layers, a 20 m deep borehole (LBH-1) was drilled next to the boundary of a sand boil after the earthquake (Figure 9). The groundwater depth was 40 cm when drilling was performed in December, 2011. Instead of 1.5 m intervals, standard penetration tests (SPT) were performed at every 1 meter depth in LBH-1 to obtain a continuous soil profile as much as possible. The soil profile of LBH-1 and the SPT blow counts are shown in Figure 10.
The plastic cap soil (CL) at LBH-1 is around 2.5 m thick as seen in Figure 10. The thickness of poorly graded sand (SP), which is supposed to be the liquefied layer in this location, is almost 4 m. After 6.5 m, thin alternations of low plastic clay (CL) and non-plastic silty sand (SM) exist. Late Pleistocene lacustrine deposits are encountered at 10 m, and are composed of mudstone and siltstone layers. A gradual increase in SPT blow counts is obvious in the LBH-1. SPT N 30 values vary between 15 and 24 in the liquefiable zone. Refusal (R) values were obtained after 10 m in lacustrine deposits.
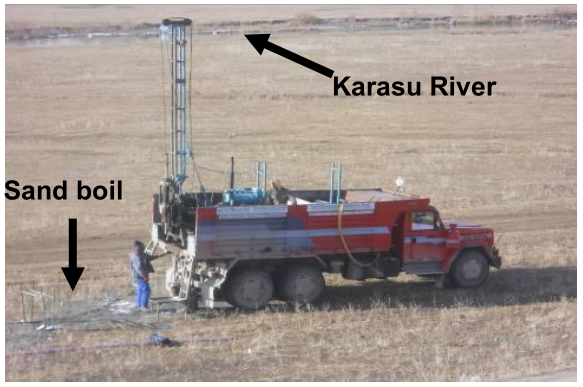
Fig. 9. Drilling on sand boil at Karasu River floodplain after the M w 7.2 Van earthquake
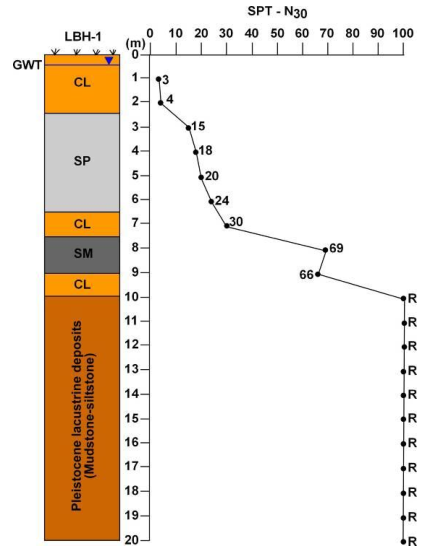
Fig. 10. Soil profile and N 30 values of the LBH-1 drilled on a sand boil (R: Refusal value)
The grain size distributions of the disturbed samples as well as sand boil samples from the surface at the LBH-1 were determined by wet-sieve analyses in the laboratory (Figure 11). The sieve analyses of sand boil samples indicate that the liquefied soil is silty sand (SM). Moreover, the SPT samples of 3 and 4 m (poorly graded sand) exhibit high possibility of liquefaction. The fine content values of the soil layers between 3 and 6 m in the LBH-1 vary between 1.6% and 8.5%. The distribution of the fine content with depth in LBH-1 is depicted in Figure 12. All grain size distributions and SPT blow counts point out that the liquefaction probably occurred in a zone between 2.5 and 6.5 m in the investigated area.
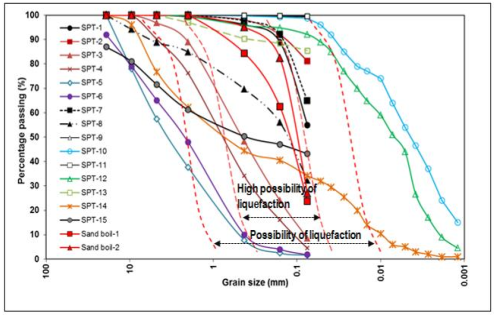
Fig. 11. Grain size distributions of the disturbed (subsurface) at the LBH-1 and the sand boil (surface) samples
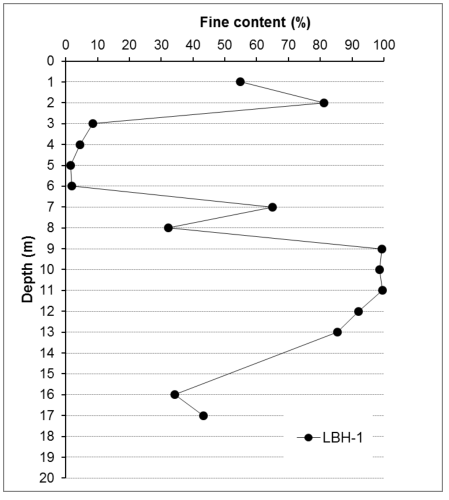
Fig. 12. Distribution of the fine content of the soil samples with depth in LBH-1
Seismic refraction surveys were carried out at four locations in order to determine the shear wave (V s ) velocity of the subsurface layers in the Karasu River floodplain where the sand boils extensively occurred. WZG-12 type engineering seismograph designed for shallow refraction survey was employed in the seismic studies. Seismic source for testing was gained by a hammer. Two subsurface layers were differentiated in accordance with the seismic investigations. The depth of the unit boundary varies between 9 and 12 m at different seismic survey points (Figure 13).
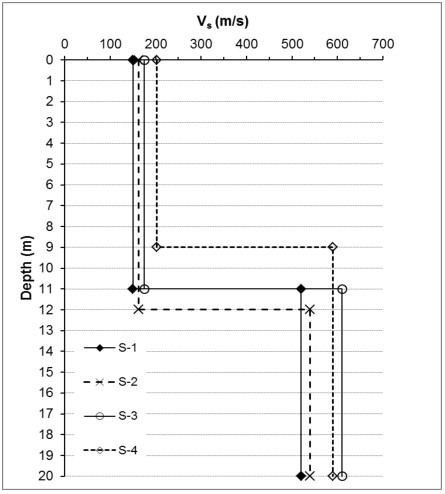
Fig. 13. Shear wave velocity (V s ) of the subsurface layers in the Karasu River floodplain
As seen in Figure 13, the shear wave velocity of the loose alluvium ranges between 150 and 202 m/s, and the velocity rapidly increases as high as 610 m/s in the lacustrine deposits. As a particular note, the lowest V p (520 m/s) and V s (150 m/s) velocities were measured on the sand boil where liquefaction occurred (S-1). In other words, the borehole LBH-1 and the seismic survey point S-1 are on the same sand boil.
CONCLUSIONS
A major earthquake with a moment magnitude of 7.2 hit the city of Van in the eastern region of Turkey and its largest district Ercis on 23 rd of October, 2011 resulting in substantial damage and casualties. Permanent ground deformations with varying amplitudes were extensively observed in many regions at the eastern and northern shores of the Lake Van and at the embankments of streams draining to this lake. The Karasu River floodplain was one of the most critical regions severely suffered from the earthquake associated ground displacements during this earthquake. By chance, no structural damage occurred as a result of these deformations as the Karasu River floodplain area is not residential. However, in several regions around the lake shores, ground deformation- related damages to one-story masonry buildings and lifeline networks were reported. The obtained geotechnical data point out that the liquefiable layers with high possibility of liquefaction exist between 2.5 and 6.5 m in Karasu River floodplain near Topaktas village. Furthermore, the groundwater depth was as shallow as 0.4 m when the exploration was performed in that region. The sand boil on the ground surface consists of silty sand according to sieve analysis whereas the liquefiable layers between 2.5 and 6.5 m were determined as poorly graded sand. Although another sandy layer (SM) is present between 7.5 and 9 m, it is not accepted as liquefiable considering high SPT blow counts (N 30 : 66-69). Therefore, it can be concluded that the sandy material on the surface was probably ejected from a zone between 2.5 and 6.5 m in the investigated area.
 ENGLISH
 Chinese
 Russian

