Multi-geophysical approaches to detect karst channels underground
Abstract
Mengzi locates in the sourth 20km away from the outlet of Nandong subsurface river, and has been suffering from water deficiency in recent years. It is necessary to find out the water resources underground according to the geological characteristics such as the positions and buried depths of the undergorund river to improve the civil and industrical environments. Due to the adverse factors such as topographic relief, bare rocks in karst terrains, the geophysical approaches, such as Controlled Source Audio Magenetotellurics and Seismic Refraction Tomography, were used to roughly identify faults and fracture zones by the geophysical features of low resistivity and low velocity, and then used the mise-a-la-masse method to judge which faults and fracture zones should be the protential channesl of th subsurface river. Five anomialies were recognized along the profile of 2.4km long and showed that tha northeast river asystem has several branches. Drilling data have proved that the first borehold indicated a water bearing channel by a chracteristics of rock core of river sands and gravels deposition, the second one encountered water-filled fracture zone with abundant water, and the third one exposed mud-filled frature zone without sustainable water. The results from this case study show that the combination of Controlled Source Audio Magnetotellurics, Seismic Refraction Tomography and mise-a-la-Masse is one of the effective methods to detect water-filled channesl or fracture zones in karst terrains.
1. Introduction
The Nandong underground river system is situated in the region of Mengzi City and emerges at Nandongtai village about 8 km north of Kaiyuan County in Yunnan Province, China. The system has an altitude of 1067 m.a.s.l. at the eastern end of the graben basin. Nandong River is a vast and deep karst groundwater system containing abundant water reserves. It is one of the four super-large-scale underground karst river systems in southwestern China and with an area of over 1000 km 2 and total discharges exceeding one billion cubic meters dur-ingthe dry season (Zhuet al., 1991; Kang, 1993; Kang and Liang, 1996).
Mengzi is a county-level city with about half million people, located within 30 arcmin. South of the Tropic of Cancer, about 20km away from the discharge outlet(Fig.1), has been suffered water shortages for years. The city has an elevation of approximately 1300 m.a.s.l. and the water table more than 150 m below the surface, it receives 2234 h of bright sunshine annually with annual rainfall about 815.8 mm and the annual mean temperature of 18.6 °C (The highest temperature at 33.8 °C and the minimum temperature of 2.9 °C, appear respectively in June and December).
Since the 1980s, considerable efforts have been made to effectively develop and use Nandong's underground water resources to reduce the cost of water pumping upstream. Suggestions that have been pro- posed in this regard include the construction of a dam at the entrance, or an underground reservoir near the discharge outlet using grout curtain engineering. However, the geological characteristics of this vast and complex cave system are still poorly understood. Surveys to date have not been comprehensive due to a lack of sufficient funds. The sys- tem needs to be thoroughly investigated before it can be successfully developed.
The Nandong system can be roughly divided into two parts, namely the northeast channels (I) and the southeast channels (II) (Fig. 1). The northeast section comprises mainly the Hongtangzi river subsystem, recharging from Dongshangding in the north, which has a total length of about 7 km although only1.58 km has been surveyed. The southeast section, conversely, comprises more than five underground river sub- systems which include the Heilongtang, Huitudi, Daheishuidong and Xiaoheishuidong subsystems in the middle of the basin, and the Pingshiban subsystem in the north. This section produces roughly two thirds of the total flow (Zhang, 1992), yet only 1.55 km of its channel network (in the vicinity of the discharge outlet) has been mapped.
In 2014, the Chinese Geological Survey (CGS) funded a hydrogeological multidisciplinary survey of the Nandong underground river watershed (Project code:12120114062601). Two working stages were planned: the first would be focused on the Hongtangzi subsystem which the Institute of Karst Geology had researched previously inamul- tidisciplinary manner. This paper is a result of the first working stage. The second working stage is focused on the southeast channels system.
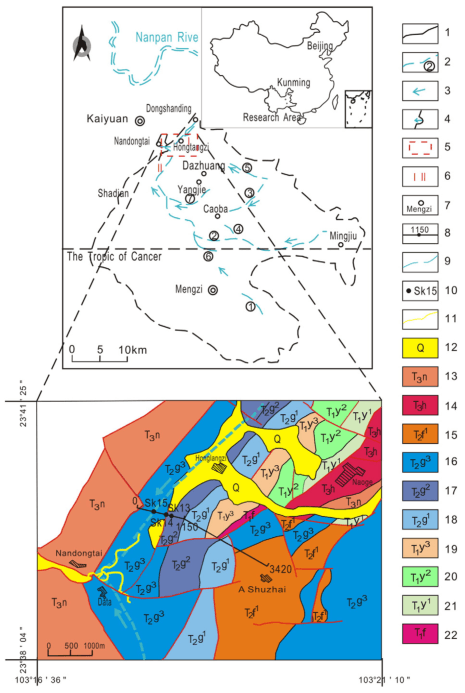
Fig. 1. Map of study area showing the Nandong underground river system (top), and the simple hydrogeological setting and geophysical profile (bottom). (1 — Underground river boundary; 2 — Underground river; 3 — Flow direction; 4 — Discharge outlet; 5 — Study area; 6 — Northeastern and southeastern system branches; 7 — Mengzi county; 8 — Station no. And profile; 9 — Karst channels; 10 — Drill hole; 11 — Cave survey;12 — Quaternary deposits; 13, 14, 22 — Sandstones and shales; 15 — Shales and sandstones;16 — Marls; 17 — Dolomites; 18 — Dolomites and dolomitic limestones; 19 — Marls interbedded with shales; 20 — Shales and limestones; 21 — limestones and marls.)
It is a significant challenge to detect and map underground karst features owing to karst heterogeneity and anisotropy. However, integrated geophysics can provide valuable and continuous information for engi- neering planning and underground grouting projects especially in karst terrains (Milanovic, 2000; Ford and Williams, 2007). Chalikakis et al. (2011) have analyzed and assessed advantages and disadvantages of different geophysical methods in karst exploration.
Zonge et al. (1986) and Zonge and Hughes (1991) present some examples and discuss CSAMT applications in detail. Gabãs et al. (2014) used the multi-geophysical methods of CSAMT, the magnetotelluric method (MT) and microtremor (H/V) analysis to characterize lithological changes, to image fault zones and to determine basin geometry. CSAMT can be used to map fracture/fissure/fault zones very effectively, and has been shown to be an ideal tool for detecting deep-seated saline connate water pockets (Roy, 2014).
CSAMT has been used successfully to map fractures and faults in the design and construction of atunnel(Zhietal.,2012).WuandShi(1996) successfully applied CSAMT to ground water exploration.
Seismic refraction tomography is one of the most recent developments in near-surface geophysics. It has been used in the identification of cross-valley faults in limestone (Atre and Carpenter, 2010), the detection of hazardous cavities beneath a road (Giorgi and Leucci,
2014), the identification of buried sinkholes (Dı'az et al., 2007; Siartet al., 2010), the exploration of tunnel hazards associated with water-bearing fracture zones (Lehmann et al., 2010), the estimation of unconsolidated zone thickness, the calculation of porosity by applying Wyllie's experimental law, and assessing the deep water table and the depth to sound bedrock (Roux et al., 2011). Guérin et al. (2009) applied seismic refraction tomography and resonance sounding to calculate the location and width of a water-bearing conduit to within a few meters, the seismic and electrical data suggest that the limestone medium surrounding the conduit is not homogeneous. Sheehan et al. (2005) conducted a comprehensive comparative evaluation of three seismic refraction tomography codes – Rayfract™, SeisImager™ and GeoCT-II™ – for eight typical subsur- face karst features, ranging from a simple layered model to small- scale epikarst pinnacles and caves.
According to Parasnis (1973), the mise-a-la-masse method was first introduced to map the sub-surface extentof a conductive bodypartially exposed on the surface or in a borehole. Stierman (1984) claimed that distortion of equipotential contours in mise-a-la-masse marked some zones where subsequent excavation encountered a thick lens contain- ingpreviously unsuspected leakage. The leakage directionof aninfiltra- tion pit was determined successfully using mise-a-la-masse (Cahyna et al., 1990). In Romania, mise-a-la-masse was employed in tracing cold water karst inflows and proved to be the optimal investigation tool in groundwater exploration (Mitrofan et al., 2008). When 50 kg of NaCl electrolyte was injected into the Valea Seaca swallet, the amplitude of mise-a-la-masse effects increased obviously, which is mentioned by White (1994) and Milanovic (2000). Due to this method being quick, low-cost, non-destructive and sensitive (especially to good conductors such as water-bearing conduits) it also can be used to obtain information regarding extent, dip, direction and continuity of karstic channels (Guérin et al., 2009).
In this study, using information from the geological survey along with data gathered during cave exploration, the methods of Controlled Source Audio Magnetotellurics (CSAMT), seismic refraction tomography and mise-a-la-masse were all carried out as a multi-geophysical approach to the study was taken. CSAMT was used to discern the geological settings and lithology of karst structures. The lower velocity zones in seismic refraction tomography contours can identify broken rocks or faults. Those mise-a-la-masse anomalies within low resistivity and low velocity zones most likely indicated underground water bearing channels. Drilling results showed that comprehensive geophysical methods can achieve very good geological results.
2. Geological setting
The Nandong underground river system boundary resembles a rectangle rotating counterclockwise (Fig. 1),withonly thesoutheastern side disrupting its otherwise fairly geometrical shape. The deposits of tertiary and quaternary sediments in the basin along with unconsolidated clays and gravels result in an overall thickness of about 1900 m with surface elevations ranging from 1213–1323 m.a.s.l. The karst plateau, situated in the north west of the basin is composed of thick carbonates and has an altitude higher than 2000 m.a.s.l. Carbonate rocks and minor clastic rocks are exposed in the low mountains south of the basin at elevations of 1500–2500 m.a.s.l. Both the southeastern and northeastern boundaries are predominantly composed of clastic rocks and water blocking faults. The Nandong river surface outlets (at an altitude 1067 m.a.s.l.) issue from two extensive cave systems in dolomites (Ma, 1993).
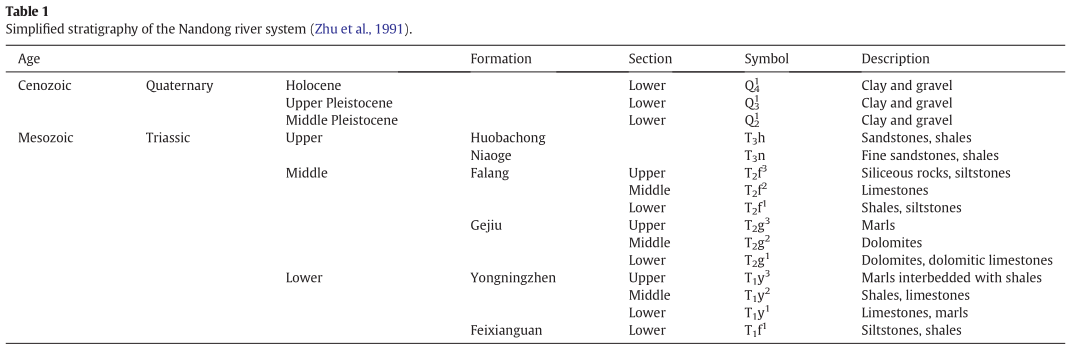
It can be seen from Table1 that the quaternary deposits along with clays and gravels have thicknesses of a few meters to tens of meters, and are mainly exposed in the valleys or on gentle slopes in the vicinity of the survey line. Triassic strata consist of three parts or six formations— the lower part of Feixianguan and Yongningzhen, the middle part of Gejiu and Falang, and the upper part of Niaoge and Huobachong. The Feixianguan formation includes siltstones and shales (with a thickness of about 230m).The Yongningzhen formation is divided into two different lithologies, namely limestones and argillaceous limestones. This formation has a thickness of about 760m in the east of the basin where it is dominated by thin limestones and marls inter-bedded with shales, and a thickness of ≥500 m near the western fringes of the basin. The Gejiu formation is dominated by thick dolomites, dolomitic limestones and marls, is more than 1700 m thick, and is the foremost layer in which karst development takes place.The Falang, Niaoge and Huobachong formations comprise mainly impermeable shales, siltstones and sandstones interbedded with limestones with an average total thickness of650 m. These layers form the main aquicludes due to their low permeability (Zhu et al., 1991).
Geologically speaking, the Nandong underground river system is located in the Southern China block, adjacent to the southeast of Sichuan Yunnan block. The earth's crust in the vicinity of the system has experienced various periods of complex evolutionary development that have resulted in a very complex local geology with highly variable geological properties acrossthe study area. First,a major fault witha northwesterly trend gradually led to the formation of a graben basin. Other faults with northeasterly and nearly northerly trends, respectively, also controlled the subsequent formation and evolution of the Nandong underground river system. The tectonic action of these multiple faults led to thecarbonaterocksin thearea becoming fractured, providing favorable conditions for the development of an underground river system. This also made the detection of the spatial distribution of under groundwater bearing channels by geophysical means more difficult (Ma et al., 2005; Luo et al., 2012; Chen et al., 2013).
The surface water and karst groundwater in the Nandong system mostly recharge from the east and south of the basin, and finally discharge at the Nandong river outlets which were characterized by maze cave systems. Seven underground river subsystems in the Nandong system were investigated in this study. Surface karst features such as caves, sinkholes,shafts and so on,also often appearsporadically along the courses of underground rivers.
3. Results and discussion
Taking highway and terrain conditions into consideration, a geophysical profile with a total length of 3420 m, divided into two sections– transverse L22(0–1150 m) striking E13°W, and transverse L21(1150–3420 m) striking E30°W – was set up approximately orthogonal to the deduced primary orientation of the groundwater channels. The profile started in the sandstones and shales of the Niaoge Formation approximately 1.8 km northeast of the discharge outlets, and ended in the shales and siltstonesoftheFalang Formation, north of A'shuzhaivil-lage (Fig. 2). The dolomites of the Gejiu Formation located in the middle of the profile represent the most likely location for the development of groundwater channels. All stations with a spacing of 10 m and elevations of 1210.9–1427.9 m.a.s.l. were measured using a Trimble 5800/R8 GPS Bluetooth Receiver with a 450–470 MHz radio transmitter. The ground surface in the study area is mostly rugged and steep, and dominated by bare rocks. Such terrain makes geophysical prospecting very difficult.
3.1. Controlled Source Audio Magnetotellurics (CSAMT)
CSAMT is a frequency-domain sounding technique that uses artificial and natural electromagnetic fields to measure variationsin resistivity which can be used to interpret underground lithology and geological structures. Cagniard resistivity (ρ a ) is given by
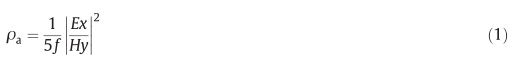
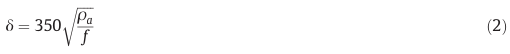
where f is frequency in Hz, Ex and Hy are in situ measurements of electric field (Ex-field) and magnetic field (Hy-field) orthogonal to the Ex-field. The skin depth – an estimate of average resistivity down to a depth – is represented by Milson (2003) and Yamashita and Eng (2006) as
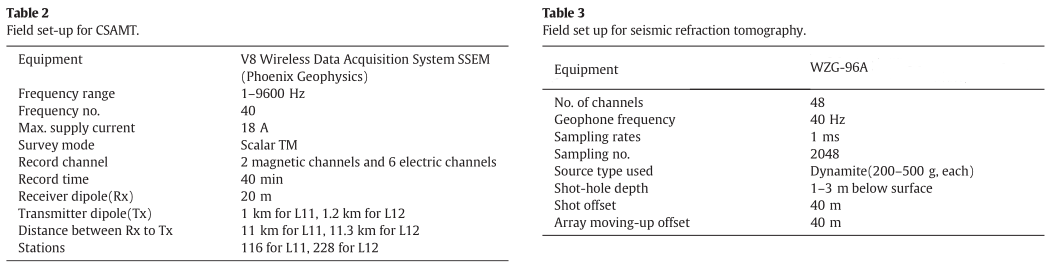
Thus in this study CSAMT, which is usually sensitive to geological structures and lithological boundaries, has been performed to provide information regarding the basic geological context, such as faults or water-bearing channels with characteristics of low resistivity anomalies, or contacts between soluble rocks and non-soluble rocks on the basis of high and low resistance contours. The field set up with respect to CSAMT is shown in Table 2. (See Table 1.)
Data pre-processing for CSAMT mainly consisted of noise reduction, smoothing, near-field correction and static correction. First, bad data or distortion points significantly affected by noise were eliminated and corrected usingnoise reductiontechniques,and then smoothed by suit- able filters. Second, near-field correction was achieved using SCS2D inversion software developed by Zonge International, USA. Third, taking the geological condition and lithology of the study area into account, only the curve shifting method was adopted for the purpose of static correction. Finally, data inversion (TM mode) was implemented using a smoothing simulation (SCS2D). Based on a 2D finite element algorithm, the initial model was created by moving-average or 1D smoothing of pre-processed apparent resistivity data. Root mean square deviations (RMS) of measured and fitted data were considered as the constrained standard. Once RMS was less than a threshold value(5) and the model smoothness met the determined requirement, the inversion process was stopped and the final model was reached (RMS =1.991).
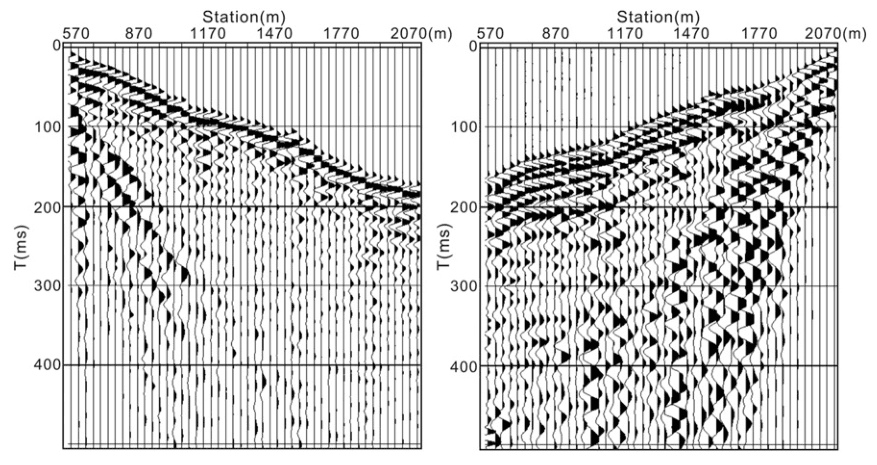
Fig. 2. Resistivity model from 2D CSAMT inversion.
Fig. 3. Seismic records for a same spread.
The resistivity contours in CSAMT distinctly show the depth characteristics of complicated electrical structures (Fig. 4). On the right, the profile is simply characterized by two resistivity layers, with the low resistivity layer overlaying the high resistivity one. In the middle and toward the left side, however, it seems to be more complicated with multiple layers of high resistivities alternating with low ones. According to horizontal resistivity readings, five faults are discerned and named F1–F5 which simply divides the section into six parts — zones A, B1, B2,B3,C1,and C2, respectively.Zone A,west of fault F1,consists of sandstones and shales with typical low resistivity characteristics. Zones B1, B2 and B3, separated by faults F2 and F3, respectively, are more or less consistent in terms of resistivity and can be analyzed as a whole. The upper and lower parts of these zones are characterized by high resistivity values suggesting that competent rocks are separated by a low resistivity layer of siltstones and shales with elevations ranging from 200–800 m.a.s.l. The lower resistivity layer in zone B1 with elevations ranging from 1000–1250 m.a.s.l. overlying a high resistivity layer and connecting with fault F2 on the right, is interpreted to consist of fractured dolomites or broken dolomitic limestones. Zones B2 and B3, although divided by fault F3, seem to be similar with regard to resistivity. The relative high resistivity values recorded for these zones are interpreted to indicate the presence of fractured dolomites and broken marls, respectively. A low resistivity zone to the right of zone B3, nearly vertically separating zone B3 from zone C1, is thought to consist of siltstones and shales at the point where fault F4 emerges. Zones C1 and C2 both have consistently high resistivity readings and even though they are separated by fault F5, they are interpreted as dolomites.
3.2. Seismic refraction tomography
Seismic refraction tomography, designed to resolve strong contrasts in velocity, was performed like general seismic refraction in the field. But at least certain shots were needed just for a spread layout or some geophones were overlapped between adjacent spread layouts to meet the reasonable velocity model available.
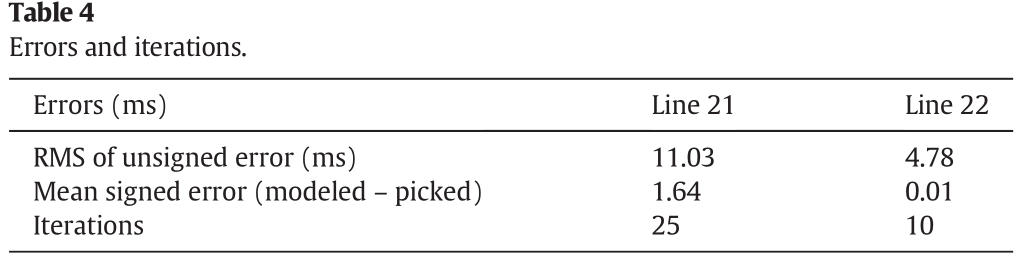
Fifty explosive shots for ProfileL11 and 34 explosive shots for Profile L12 were recorded using 48 vertical geophones spaced 10 m apart according to the acquisition parameters listed in Table3.Two shot records are presented in Fig. 2. First arrival times were picked using SeisImager Pickwin and processed using Rayfract. The final velocity models were obtained when error changes reached a minimum (Table 4).
Fig. 5 shows the seismic refraction tomography results of profiles L21, L22, displayed as velocities varying with depth. The maximum depth of penetration was about 200 m below the surface due to limitations of the array length, explosion safety considerations, etc. No high quality records were available between the stations at 1150 m and 1970 m because of high background noise while seismic spreads crossing the highway. Velocities ˂2000 m/s (dark blue) could be related to subsoil, weathered sandstones or shales with thicknesses ranging from 0–60 m. Places where the overburden was found to be thick were situated around the station 800 m in a valley, and bare rocks were common at the top of hills along the profile. Those zones with ve- locity readings of 2000–3500 m/s (blue to dark green) may possibly represent faults or fractured rocks. Competent rocks will exhibit high velocities, usually more than 3500 m/s (yellow to red), depending on their lithologies. Significant contrasts in velocity generally indicate lithological changes such as contacts between soluble and insoluble rocks.
Based on geological survey and CSAMT data correspondingly(Fig.4), the shales and siltstones(T 2f3 )atthe2740–3400m stations were easily identified, and contact faults F1 and F5 were easilyinterpreted based on significant contrasts in both resistivity and velocity values. In the same way, fault F4 has been corroborated at the 2230 m station. A typical zone with lower velocities (˂3000 m/s), between the stations at 480 m and 720 m at elevations of 1080–1220 m.a.s.l. can be named as fault F6 but it is shallow and shows no clear anomaly in resistivity compared with the CSAMT data (Fig. 4).
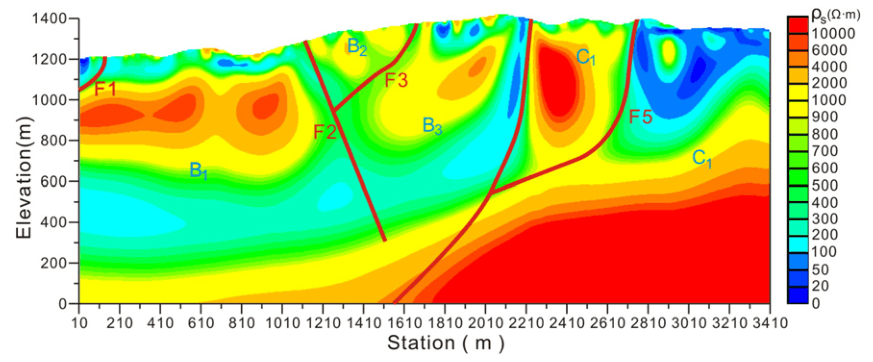
Fig. 4. 2D velocity models from seismic refraction tomography for profile L22 (left) and L21 (right).
3.3. Mise-a-la-masse
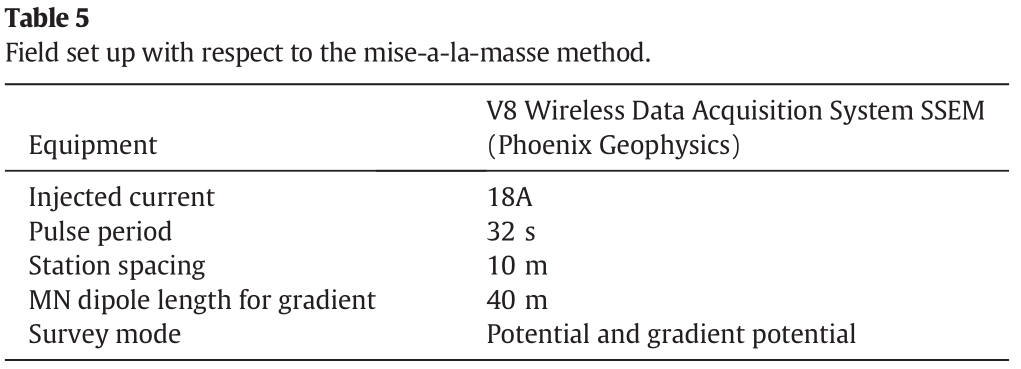
In practice, one electrode induced very high amperages directly into the Nandong underground river outlet by using TXU-30 (by Phoenix geophysics). A second current electrode, sometimes called the infinite electrode, was located a large distance (approximately 1500 m) away from the first. There are two modes by which to survey potentials and gradient potentials, respectively, using the mise-a-la-masse method (see Table 5).Inthis study, while the currentwasinduced,the potential and gradient potentials were collected simultaneously and synchronously along the profile. For the measurement of gradient potential, two electrodes were kept at a constant distance apart and moved along the line. However, for the measurement of potential, only one electrode was needed. The other, called the reference electrode, was placed at infinity. All measurement electrodes were non-polarizable.
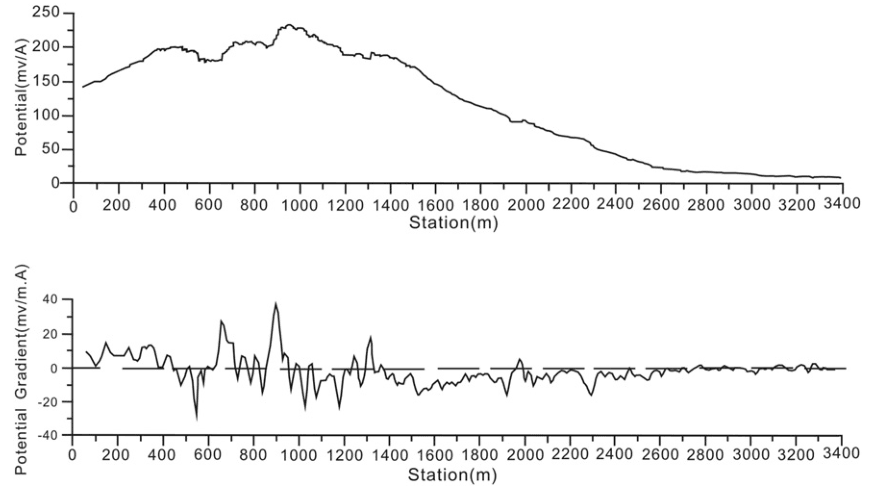
The results produced by the mise-a-la-masse are shown in Fig. 3 as potential and gradient potential curves, respectively.To identify and differentiate weak anomalies from a point source field (background field) at high intensity, it is necessary to eliminate or reduce the effects of background field as much as possible.
The Fraser filter (Fraser, 1969), a low-pass smoothing operator, is often used to enhance signal and make peaks or zero-crossovers easier to identify. The filter operator can be expressed as.

where f n,n+1 is the filtered data pertaining to numbers supposed con- secutive number values between the nth and the (n + 1)th, and M n−1 −M n+2 are four adjacent points in the original data. Peaks on potential curves turn to zero values, whilst zeros on the gradient potential curves convert to peaks after Fraser filtering. This simple processingnot only retains distinct anomalies but also makes weak anomalies more obvious.
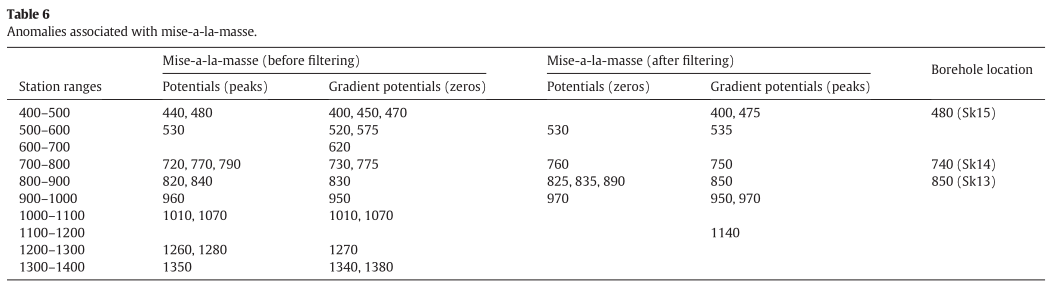
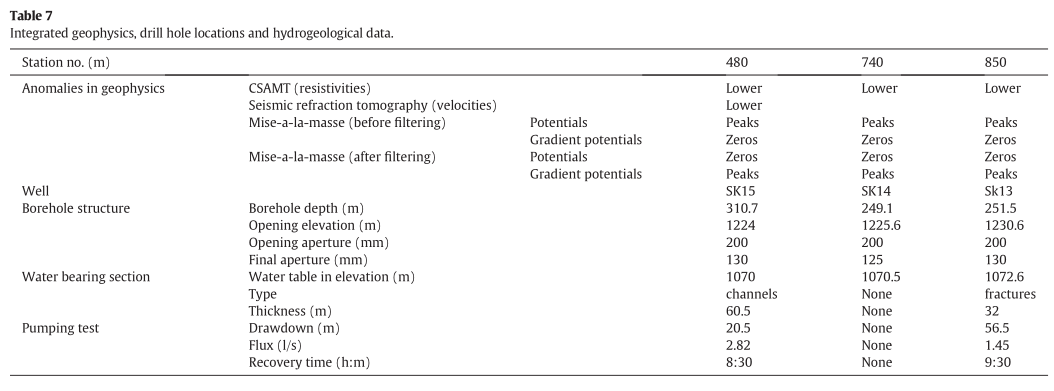
After Fraser filtering, anomalies in potential curves become zeros whilst potential values across the zero line change from positive to negative. The maximum values (peaks) on gradient potential curves are effective anomalies (Fig. 6). A comparison of potential with gradient potential curves (Fig. 2) reveals that all anomalies located within the dolomites appear between the 400 m and 1000 m stations. This zone can be divided into five parts for analysis whilst fully considering both anomalous variations in amplitude and ground water table at an elevation of about 1100 m.a.s.l. (Table 6). (See Table 7.)
The first anomalous area, between the 400 m and 500 m stations, and most obviously from 440–480 m, is not only consistent with lower seismic velocities steeply dippingto theleft (Fig.5) in the vicinity of fault F6 but is also associated with lower resistivity readings of approximately 1000 Ωm from CSAMT (Fig. 4). The second anomalous area has the same characteristics as the first one, and is situated between the 520 m and 535 m stations. The third anomalous area, between the 720 m and 790 m stations is consistent with lower resistivity readings with concaved contours at about 1000 Ωm according to the CSAMT but not corroborated by seismic refraction tomography because of limited penetrations or non-applicability. Both the fourth and fifth anomalous areas (820–850 m and 950–970 m, respectively), not constrained by seismic refraction tomography, are similar (in terms of resistivity and variation characteristics) to the third area according to CSAMT.
Considering geological structures, lithology, groundwater table and geophysical data (Table 6), a geological section is presented in Fig. 7. The five anomalies that emerged are interpreted to be most likely associated with water bearing channels.Three boreholes were drilled at stations 480 m (SK15), 740 m (SK14) and 850 m (SK13), respectively. Because of limited funds available in the first stage of this project, along with the rugged and steep topography, neither the second nor the fifth anomalous areas have yet been investigated by drillings.
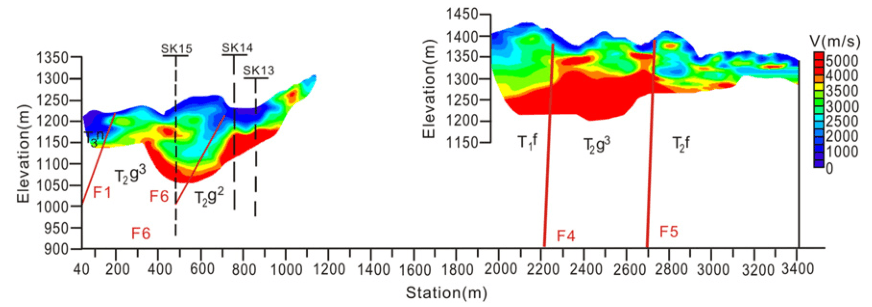 Fig. 5. Potential and gradient potential curves for the Nandong river before filtering.
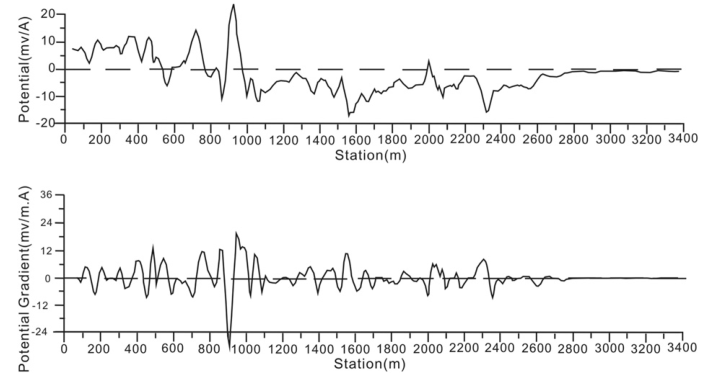 Fig. 6. Potential and gradient potential curves after Fraser filtering.
The drilling data(see Table6) shows that borehole SK15 intercepted water-bearingfracturesin dolomite with a thickness of 32 m and elevations of 998.6–1030.6 m.a.s.l. The borehole SK14 without sustainable water yield was characterized by two sections of mud-infilled fractured dolomites, one from 1078.6–1092.6 m.a.s.l. and the other from 1017.6–1044.6 m.a.s.l. When drilling borehole SK13, multiple caves containing river sand and pebble beds with thicknesses 10 m were encountered at about 1079 m.a.s.l. It can be inferred that the main karst channels are likely to have developed nearby.
Those fractures (in the case of SK14) or caves (in the case of SK13) more than 150 m below the surface are not easily detectable by seismic refraction tomography partly because of limited penetration depth and partly due to the presence of competent overlying rocks with high velocities.
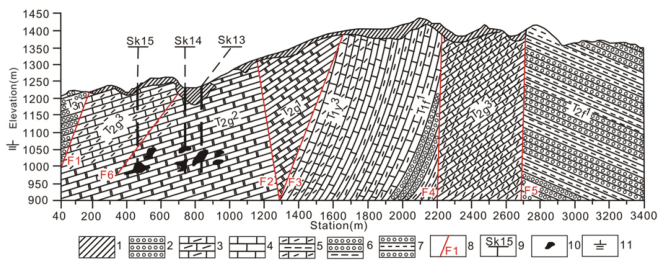
Fig. 7. Geological interpretation section.(1Quaternary; 2 Sandstones, T 3n ; 3 Marls, T 2g 3 ; 4 Dolomites, T 2g 2 ,T 2g 1 ; 5 Marls interbedded with shales, T 1y 3 ; 6 siltstones, Shales, T 1f 1 ; 7 Shales,siltstones, T 2f 1 ; 8 Fault 9 borehole and reference number; 10 Interpreted channel; 11 Water table at discharging outlet.)
4. Conclusions
In thesekarstrugged terrains,the generalgeologicalsettings suchas geological structures and lithological contacts can be obtained by using SCAMT and seismic velocity tomography while combined with the geological survey. Competent dolomites show higher resistivity and velocity, marls interbedded with shale have relatively low resistivity and high Velocity and broken rocks can be identifiedby those zones with relatively low resistivity (less than 1000 Ωm) and low velocity b3000 m/s.
So,the mise-a-la-masse anomalies within those broken rocks reduce uncertainty and present potential information about underground water bearing channels.
Based on the integrated geophysical and three boreholes data, it may be speculated that the underground river channels in the northeast of the Nandong system are most probably characterized by multiple branches (represented by five anomaly zones). These channels develop predominantly in Triassic dolomites at stations of 400–1000 m (profile L22),beingsituatedbetweenfaultF6andfaultF2withelevationsN1000 m.a.s.l., more than 150 m in depth.
This multi-geophysical approach is likely one of the most effective methods in this project for locating deep underground river channels.
 ENGLISH
 Chinese
 Russian

