The Resistivity Tomographic Imaging Technology Application in the Hydrogeological Survey
Abstract. As a new geophysical exploration technology, the resistivity tomographic imaging technology has been widely used in many fields. This paper expounds the basic theory of resistivity tomographic imaging technology, and the influence of water on rock resistivity. Through the case analysis to understand the resistivity tomographic imaging technology application in the hydrogeological survey.
Keywords: Resistivity; Tomographic imaging; Three-Pole; Hydrogeology survey
Geophysical tomography is a new technology that using surface, drilling, or underground tunnels to lay out emission source and receiver, received with internal information of target data, then refactor it with this data to detect the internal distribution of physical properties. At present, the main geophysical tomography technology have resistivity tomography, seismic tomography and electromagnetic wave tomography and so on. Compared with seismic tomography and electromagnetic wave tomography with high efficiency, resistivity tomography has many characteristics such as high speed, low cost, large volume, high resolution, large penetration depth, easy to explain data information and so on. The resolution of the reconstruction image is much better than conventional resistivity interpretation[1-3].As one of frontier of geophysical exploration techniques, resistivity tomographic imaging technology has widely application prospect.
Resistivity tomographic imaging is a geophysical prospecting method that is based on the dielectric conductivity differences, forming the underground DC current field by artificially stimulate ,Observing the potential difference that be product by Dc power excitation electric field in different directions around the Detection , reconstructing geological body internal structure though date inversion ,describing the geometry of geological target within the scope of Current field and medium distribution accurately. It belongs to array point exploration method, has the same principle with the conventional resistivity method that combine profiling and Electrical sounding[4]. When rock mass structure has damaged,there are more Fissure
structures. When the rock structure was destroyed, fractured structure increased, current conduction is affected; without water in the fractured structure ,rock resistance value is too large ;while fractured structure full of water, resistivity value is less than that of the surrounding rock, for the conductivity of water is higher than rocks and enhance conductivity of rocks[6-7] .
Geological characteristics. Tectonic units in the project area LAY in Sino-korean paraplatform (I) in the fenhe-Weihe down-faulted basin (I I) and the North Qinling fold line (II1) in the Qinling fold line (II). In the region, Complex geological and tectonic environment makes a worse stability of regional tectonic. It is Mainly across low mountains, the loess tableland in the Weihe downfaulted basin and three geomorphic units, and mainly exposed archaean-taihua group, presinian kuanping group , yanshanqi granite,tertiary sedimentary rock and IV department loose layer. Distribution are large granite of North Qinling mountain slope, mostly radical, especially in Indo-Himalayan yanshanqi granite intrusions, is a type of magma granite. Mesoproterozoic kuanping group strata distribution in the Qinling Mountains Qinling Ridge also has a lot of as formed by mixing rock of granite rock, some of which reach the granite effect later, forming the characteristic mixture of granite, is an account of the continental crust-type Granites.
Geophysical characteristics. Archaean-taihua, and Qian Aurora Department wide ping group metamorphic rocks, and Yanshan period granite Has a high resistivity value distributed in the workspace, Tertiary sedimentary rock and the IV Department loose layer resistance value is lower, in electric, bedrock and the overlying strata have more obviously of differences, it provides the necessary geophysical prerequisite,by using electric method to identified covered layer thickness, and Formation lithology and concealed constructed.
Measurement system. This is made of high density electrical resistivity tomography, and used instruments as WDJD-4 multifunctional digital DC induced polarization instrument combined with electrodes WDZJ-4 multi-switcher. WDJD-4 is an instrument advanced transmitter and receiver functions in one, having small size and light in weight, it could measure parameters of looking water sunch as voltage, current, resistivity, spontaneous potential, polarizability, metal factor, semi attenuation, attenuation, inspires ratio ,deviation and so on . Field data acquisition is using unilateral three-pole continuous rolling equipment, the power supply voltage is 300V, electrode distance is 10 meters, this maximum isolation coefficient is 20 stories.
Data acquisition and processing. The data collection is an important link at the whole process, Acquisition quality directly affect the effect of tomographic imaging analysis.in order to ensure as far as possible in their work more effective information is collected, for the bad power supply grounding electrodes should be taken to increase the depth as well as move the grounding point, take measures such as watering, make sure the grounding electrode work correctly. Ground effect is not good, or interference of the larger point is called distortion, distortion data can be discarded or smooth average approach in data processing but how smooth should not be too large, so as not to smooth out useful information, reduce the resolution[7-8].
Data processing is an important means of improving resolution. It should be based on conditions and device systems, as well as the analysis of modeling results, taking high-pass or low-pass filtering process to eliminate or minimize surface disturbance and oscillation interference due to polar distance. Data processing using high-density two-dimensional RES2DINV[9], RES2DINV inversion program is a way to automatically determine the electronic imaging measurements of ground resistivity in two-dimensional model by least-squares inversion method ,it applies to two dimensional quick inversion of resistivity and induced polarization data, can be used for large-scale data about 25~650 electrode (around 100~5000 points) inversion. Meet the accuracy of model based on using surfer software to draw the lines of the drawing resistivity chromatography section, according to the high or low resistivity, can be interpreted as water-rich, fault zone, and so on. To achieve the purpose of exploring the hydrogeological characteristics of the aquifer.
Data interpretation. The sections with a total length of 0.75km, towards the East, landscape belongs to the Qinling mountain area, the surface mainly is Piedmont slope sediments, and steep terrain. Shallow layer mostly is Holocene wind slope sediments, lithology mainly with loess-like soil and gravel loam, electrical resistivity is between 10 to 70 ohm meter ,the lower part of the bedrock lithology is mainly granite. the electrical resistivity is between 10 and 5000 ohm meter .
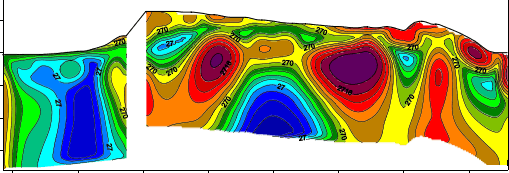
Figure. (1) 43350 ~ 44100 period of resistivity tomography
By resistivity tomography can be seen, the resistivity shows high resistance of the section, macroscopically reflects the relatively shallow bedrock depth from West to East, there is outcropping rock, resistivity changes in the West is relatively small, mainly between 10 and 700 ohm meters, and present a high resistance in the eastern part, value is between 200 and 5000 ohm meters. Vertically, from shallow to deep resistivity increases gradually, covering layers, superficial resistivity lower surface, local distribution of both high.
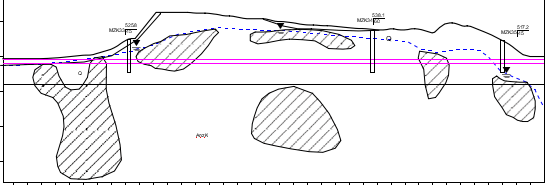
Figure. (2) 43350~44100 Geological inferences figure
The overlying unconsolidated layers in this section (Holocene wind slope sediments) have a great difference with the underlying Marble the schist and granite in resistivity value. Formation on the demarcation line in the resistivity tomographic generally performs the changes of gradient zone from low-resistance to high in vertical and horizontal. on transverse, this resistance value reflect higher in east than west .On the macro ,it reflects on the bedrock buried depth from deep to shallow from west to east; On longitudinal, resistance value gradually increases from shallow to deep, the surface resistance
value is general lower, but it has high resistance ore distribution in part , it reflects well electrical characteristic of the overburden layer on the bedrock and the weathered bedrock obviously. Figure (2) shows the inferred bedrock top surface boundaries, West of the Pile No. 43550 ,bedrock depth probably has 10 meters around; Central pile, for 43750 there is cover in the surface, about 10 meters deep, the rest of the section ,bedrock has appeared ,the hole bedrock surface is shallow in relatively.
According to several local characteristics of low resistivity in the profile and three drilling data distribute in 43680 43850 and 43050, it can infers that low resistivity anomaly zone is the development of regional strata fracture, its water content is very good.
From resistance chromatography analysis knows that the length of 10 to 50 meters depth is the Interface of surface relative high resistance and the underlying low resistance .based on the features of ore resistance will decreases as containing water obviously it can be speculated underground-water distribution as figure (2) shows. So the inferred results showed that shape of the underground-water level line has the same shape with the terrain in this section the depth of the underground water is 10 to 50 meters, which the East level is much deeper, and the West is more shallow.
Based on the relationship between the resistivity of rock and humidity, this article applies the theory of resistivity tomography to hydrogeological exploration. Through analysis the electrical resistivity tomography results in the example, and combine with the drilling information to infer and interpret the underground water level and water-rich area.
Electrical resistivity tomography, like other tomographic imaging are ill-posed problems, so it has the non-uniqueness solution. Therefore data collection should be much dense, full, accurate and reliable combined with the known drilling information or other geophysical exploration information, interpreting with Comprehensive interpretation, could make a more objective conclusion.
 ENGLISH
 Chinese
 Russian

