Application of 2D Resistivity Imaging and GIS in Dam Foundation of Nigeria
Abstract
This study highlights the application of geophysical and remote sensing/GIS techniques in the study of the proposed Otobi dam ax- is/foundation in southeastern Nigeria in order to establish: optimal depth to bed rock, the rock type which make up the foundation, the geological struc- tures of the foundation, overburden thickness, concealed basement morphology, fractures /seepage channels in the subsurface thus, enabling the eval- uation of the suitability of the proposed dam foundation. In this study, lineaments have been extracted directly from digital TM Land sat image after a series of enhancements and bands ratioing.The Arc GIS version 10.0 and ILWIS 3.1 was used to generate thematic drainage maps, lineament maps and rose diagram of structures. The interpretation of the satellite image of the area showed that the proposed dam foundation is dominated by NE-SW trend- ing fractures and this is in tandem with most of the fractures observed on outcrops of Otobi sandstone in the area. This was followed by an electrical resistivity profiling along the proposed dam axis using the Wenner array. The 2D resistivity imaging reveals that the upper layer of the study area to be 7- 10metres thick and consists of alluvial and residual soils with resistivity values ranging from 8-100 ohm-m. The second layer is over 10metres thick and has a resistivity value of 5-50ohm-m and made up of moderately weathered shales and mudstones with parallel permeable groundwater rich zones which are indicative of fractures. The results of the study indicate that the proposed Otobi dam foundation is underlain by numerous fractures which are detrimental to the dam and could serve as seepage channels through the dam.
Index Terms— Dam foundation, Electrical resistivity, Geographic information system, Lineament, Nigeria, Otobi, and Remote sensing,
1. Introduction
The study are is Otobi village which is about 12km southwest of Otukpo twon and about 1km northwest of Otobi community headquarters. It is in the Otukpo Local Government Area of Benue State and lies between longitude 8° 03' 06'' and 8° 06' 17'' East and Latitude 7° 05' 58'' and 7° 08' 08'' North (Fig.1 and 2). The proposed dam is to be constructed along the northwest southeast trending Okpokwu river.
Dams are among the largest and most important projects in civil engineering (Coduto, 1999). For geologic, hydrologic and topographic reasons, there are limited numbers of ideal sites for dams.
It is therefore very important to carry out geotechnical and geophysical investigations on any proposed dam site (Oladapo, 2011). The information provided by the study is expected to aid dam site investigation. Dams intended for wa- ter supplies require a low tolerance of seepage losses. Besides, the design of dam structures must be adapted to the existing site conditions (Ajayi et al., 2005) to minimize the losses. Fail- ure to do any of these may invariably result in unplanned seepage and/or total collapse of the structure (Olorunfemi et al., 2000). Biswas and Charttergee (1971) examined causes of dam failures worldwide and discovered that 25% of the fail- ures were due to geotechnical problems associated with seep- age, inadequate seepage cut-off, faults, settlements and land- slides.
The proposed dam site location and dam orientation(Figure 2) was selected on the basis of existing hydrologic and hydraulic studies together with preliminary engineering geology investigations and testing conducted by the federal ministry of water resources in Nigeria.
The present study is an assessment of the dam axis/foundation using an integration relatively recent reomote sensing/gis approach and the conventional 2D resistivity technique to further investigate site geology, nature of over- burden materials, the geological structures and drainage char- acteristics of the proposed dam axis and reservoir areas. This paper present the result of an integrated geotechnical geo- physical survey and GIS studies of Otobi dam ax- is/foundation.
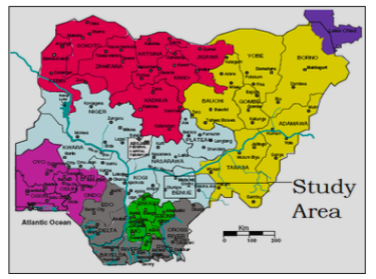
Fig. 1. Map of Nigeria showing the study area. (Modified after Obaje 2009)
2 GEOLOGIC SETTING OF STUDY AREA
The study area is specifically underlain by the rocks of the Anambra Basin (Nkporo Shales and Otobi Sandstones), SE Nigeria. The Anambra Basin is a Cretaceous sedimentary ba- sin, located in the southeast portion of Nigeria and bounded by the Abakaliki anticlinorium of the southern Benue Trough to the east and by the Basement Complex of the southwestern Nigeria to the west.
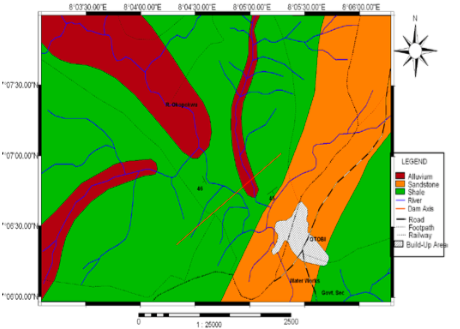
Fig. 2. Geological map of the study area showing the different sedimen-tary units.
Geologically, the origin of the Anambra Basin(Fig 3) is intimately related to the tectonic and sedimentary cycles responsible for the origin of the adjoining southern Benue Trough during the separation of African from the South American plate in the Mesozoic era. Studies of Nwachukwu hoque and ezepue and ladipo among others, have shown that, subsequent to the uplift of the Benue- Abakaliki fold belt during the Santonian, the geological histo- ry of the Anambra Basin is linked to the post-Santonian sub- sidence of the then Anambra platform. This was followed by a series of trans-regression cycles leading to sedimentation of about 6 km thick of Cretaceous and Tertiary sediments (Obaje et al. 1999) within the basin to the west of the Abakaliki uplift during the Campanian–– Paleocene.
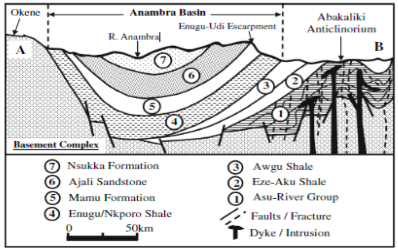
Fig. 3. A cross-sectional view of the sedimentary units within the Anam- bra Basin (After Aghamelu OP and Okogbue CO (2011)
A summary of the main sedimentary units within the basin is briefly described below:
(a) Enugu-Nkporo Shales Group: These early Campanian units underlie the eastern plain of the Udi-Enugu escarpment and consist of dark grey fissile, soft shale and mudstone with maximum thickness of about 1,000 m and characterized by interbedded sandy units and sulfur coated marl. A shallow marine environment was predicted due to the presence of foraminifera and ammonites (Reyment 1965; Agagu et al. 1985).In general the Nkporo group and their lat- eral/stratigraphic equivalents (i.e. Afikpo Sandstone, Enugu formation, Otobi Sandstone, Lafia Sandstone, Owelli Sand- stones etc) overlies an angular unconformity. The group com- prise the lowest stratigraphic units of the Anambra Basin. The Nkporo group consists of dark grey to black fissile, friable and soft shales and mudstones with occasional thin beds of sandy shale, fine sandstone and marl with coatings of Sulphur.
(b) Mamu Formation: This is a Late Campanian sedimentary unit, also known as the ‘‘Lower Coal Measures’’. It consists of mainly dark blue to grey shales/mudstones units with alter- nating sandy units and coal seam horizons to form a character- istically stripped rock unit. The Mamu Formation was depos- ited as shallow water of the paralic facies of a deltaic complex
(c) Ajali Formation: This is a Maastrichtian sandy unit overlying the Mamu Formation and consists of white, thick friable, poorly sorted cross-bedded sands with thin beds of white musstone near the base. It is characterized by large scale cross bedding with dip angle as high as 20. Studies have suggested that the Ajali Formation is a continental/fluvio-deltaic sequence, characterized by a regressive phase of a short-lived Maastrichtian trans-regression with sediments derived from westerly areas of the Abakaliki anticlinorium and the granitic basement units of Adamawa-Oban massifs to the eastern side of the basin (Benkhelil 1986; Amajor 1987; Ladipo 1986, 1988; Adediran 1991).
(d) Nsukka Formation: This is a Late Maastrichtian unit, lying conformably on the Ajali Formation and consists of alternating succession of sandstone, dark shales and sandy shales with thin coal seams at various horizons, hence termed the ‘‘Upper Coal Measures’’. The sedimentary successions indicate a paralic environment.
Surface geologic mapping revealed that the area is mainly un- derlain by the Nkporo shale formation and the Otobi sand- stone which are obscured by weathered shale and mudstones forming dark overburden in some parts of the area and red- dish to brownish top soils in other parts (Fig 2).
Exposures of the Nkporo shales were observed along the Ok- pokwu stream and consist essentially of clays, shales and mudstones. The Nkporo shales are highly weathered in most parts of the study area and are seen as residual soils (clays, silty clays and sandy clays).At the Southeastern part of the study area there are sandstones exposures which represents the Otobi sandstones. The sandstones displayed a high degree of jointing which suggests that the area has been affected by a tectonic episode in the past. Along the Okpokwu River, there are alluvial deposits mainly composed of silty clay, clayey silt and sandy and gravelly clay of Quaternary age.
3. MATERIALS AND METHODS
The study commenced with a reconnaissance survey which was accompanied by a geological mapping, a remote sensing and geographic information system studies and geophysical investigation. The geological investigation in the study area was done to ascertain the information provided by the existing geological maps of the area. Based on the observed field geol- ogy a geological map of the area was produced (Fig 2).
For the study, existing hydrogeological and relevant data on soils, geological/lithological units, and structural features, geomorphologic and climatic conditions of the study area were collated. The overall study concept involved integration of relevant thematic layers of conventional geology, drainage and lineament maps, using ArcGIS 10.0 and ILWIS 3.1 GIS software. All of the map themes were presented in UTM Projec- tion Zone 31, Datum WGS84.
3.1 Preparation of thematic layers
The anglogue drainage, lineament maps of the study area abtained from Nigeria Geological Survey Agency(NGSA) with scale 1:100,000 were georeferenced and digitized in ArcGis 10.0 software platform (Fig 4, Fig 5 and Fig 6 respectively). These were also complimented with data from Landsat images obtained from the National Centra for Remote Sensing in Nigeria (NCRS). Lineaments are manifestation of linear features that can be identified directly on the rock units or from remote sensing data while lineaments and their intersections play a significant role in the occurrence and movement of groundwater resources in rocks (Rao 2006; Prasad et al. 2008). The presence of lineaments may act as a conduit for ground- water movement which results in increased secondary porosi- ty and, therefore, can serve as groundwater potential zone or otherwise (Obi Reddy et al. 2000).
Drainage pattern reflects the characteristic of surface as well as subsurface formation. The drainage pattern of the basin also provides quantitative description of basin geometry. Drainage map (Fig 5) was obtained from DIVAGIS
Subsequent to the preparation of all the different thematic maps (drainage density, geology and lineament thematic maps) with varied attributes, the maps were converted into raster format.
The geophysical studies was done in collaboration with Han- som Engineering Consultant Limited. A multi-electrode resis- tivity surveying system was used, which is composed of WDA-1 Super Digital DC Resistivity/IP Meter and WDZJ-3 Multi-electrode Converter. Three boxes of 90V batteries were used to provide working power. A pocket PC with blue tooth was used for data receiving, displaying and memorizing measured results. The BT-WYS electric Processing Specific Program was used to make the interpretation more convenient and visual.
A total of 3.8km geophysical surveying profiles was accom- plished during the work.
The DC High Density Electrical Resistivity Survey was em- ployed in this study using the Wenner configurations. In the Wenner array configuration, potential electrodes are nested within the current electrodes with a common lateral distance between adjacent electrodes called the electrode a-spacing. For sounding measurements, the electrodes in a Wenner array are expanded about a center point by equally incrementing the a- spacing. The current therefore progressively passes into deeper layers, with the nominal depth of investigation being equal to the a-spacing. This procedure provides apparent re- sistivity values that are dependent upon vertical conductivity variations of the subsurface.This configuration was selected because it generally provides for high signal-to-noise ratios, good resolution of horizontal layers, and good depth sensitivi- ty(Ward,1990).
The unit electrode spacing of 10m was used for the study and the profile surveyed for one time is 590m long with 60 elec- trodes (each side of the station 30 electrodes) are arranged along the proposed dam axis in a straight line. The investiga- tion depth is almost 25m.
4. RESULTS AND DISCUSSION
4.1 Geological mapping
Surface geologic mapping revealed that the proposed dam site is mainly underlain by the Nkporo shale formation and the Otobi sandstore(fig.2) which are obscured by the weathered shale and mudstones forming dark overburden in some parts of the are and reddish to brownish top soils in other parts
4.2 Remote sensing/Geographic information system
Figures 4 and 5 are drainage maps generated from satellite image and topographic map respectively. It would be ob- served that the drainage map in Figure 4 shows that some of the rivers have gone extinct as compared with the drainage from the topographic map (Fig. 5) and based on the dam axis initial plan it has to be adjusted to be able to meet up with the three main rivers tributaries (Figure 4).This would significant- ly increase the overall discharge into the dam.
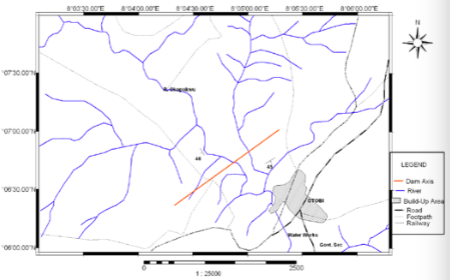
Fig. 3. Drainage map derived from Topographic map.
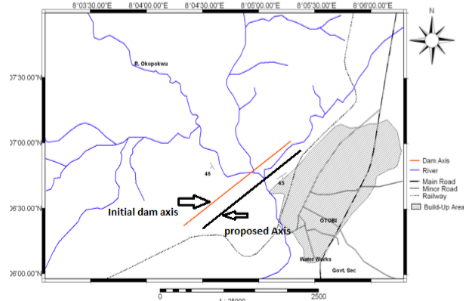
Fig. 5. Drainage map derived from Landsat image
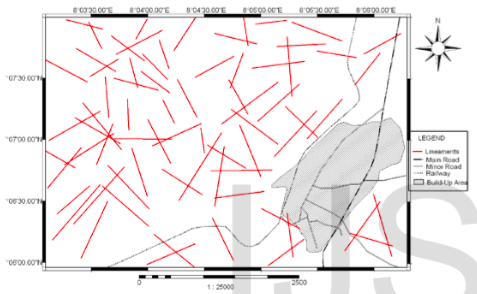
Fig. 6. Lineament map of study area.
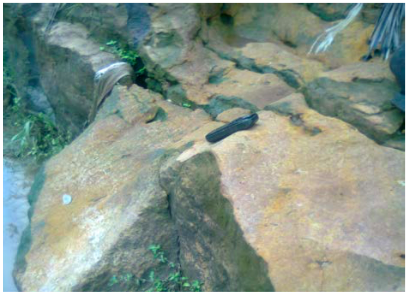
Fig. 7. Fractures observed on Otobi Sandstone outcrop in the study Area
From the above fracture map (Fig. 8), it is visible that about eight (8) fractures are directly or indirectly under the proposed dam axis and even crossing it at about four locations. These micro-fractures are of immense importance to the study as they form part of the objectives of the work. To this effect, it is suggested that these fractures are located and appropriately grouted to forestall loses of water upstream.
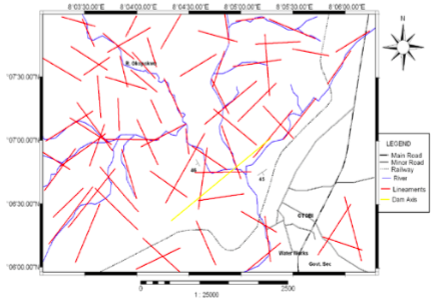
Fig. 8. Combined drainage and lineament map of study area
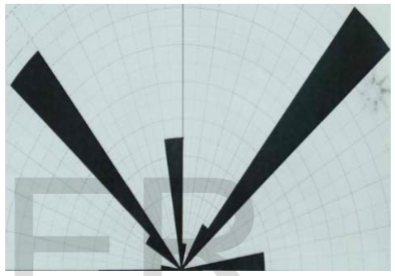
Fig.9 Rose diagram of lineaments in the study area
Conversely, the concentration of the fractures along the streams in the study area (Fig.8) might be a pointer to the fact that the streams are fracture controlled and the presence of intersecting fractures along the streams is indicative of possi- ble groundwater recharge zones to the stream (effluent streams) and this could further suggest that the streams are perennial and this is advantageous to the dam. The zones with intersecting fractures are normally good points for the drilling of boreholes for groundwater abstraction. (Edet et.al 1998 and A. Elfouly 2000).
The rose diagram (Fig. 9) shows the general trend of the line- aments in the study area. Four main trends were observed: NS, EW, NE-SW and NW-SE. The dominant trend is the NE- SW trend and it appears to be controlled by NE-SW trending shear zones of the late Pan-African age which were reactivated during its opening-up by sinistral shears. (Benkhelil et.al 1989)
4.3 Electrical resistivity profiling
The high density electrical resistivity survey profiles for the proposed dam are shown in Fig.10 to Fig.11
To interpret the data from .the 2-D imaging survey, a 2-D model for the subsurface which consists of a large number of rectangular blocks was used. A computer program was then used to determine the resistivity of the blocks so that the cal
profile direction NE
Elevation (a.s.l)
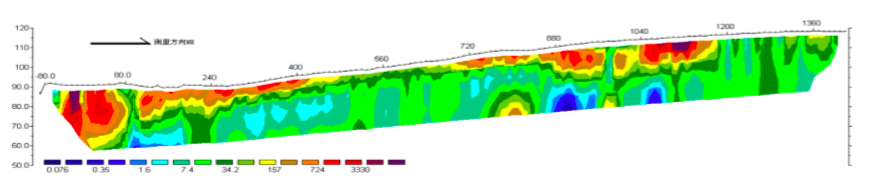
Resistivity in Ω.m unit Electrode spacing 10 m (Iteration 4 RSM error=29.1%
Fig. 10. Inverse model resistivity section for left bank of the dam axis profile direction NE
Elevation (a.s.l)
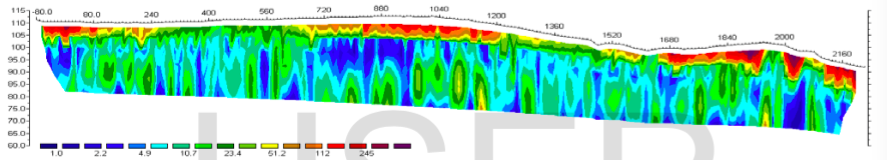
Resistivity in Ω.m unit Electrode spacing 10 m (Iteration 4 RSM error=7.4%)
Fig.11 Inverse model resistivity section for proposed Dam axis right bank
culated apparent resistivity values agree with the measured values from the field survey. The computer program automat- ically subdivided the subsurface into a number of blocks, and it then uses a least-squares inversion scheme to determine the appropriate resistivity value for each block. The location of the electrodes and apparent resistivity values was entered into a text file which can be read by the program.
The contour lines of equal resistivity in the profiles are distin- guished with different colors which represent resistivity in ohm.m. These maps are inverse model profiles after four or five times of iteration, which are more sensitive to groundwa- ter and showing more detailed in the maps. The common re- sistivity values of topsoil, clay, shales and mudstones are al- most within same range, for the former two, 8-100 ohm.m, for the latter, 5-80 ohm.m. Based on the obtained resistivity val- ues, the subsurface rocks were divided into two groups.
The first group consists of the top or cap soil alluvial and re- sidual soils consisting of completely weathered shales and mudstones near the ground surface); the second group in- cludes moderately (and part of highly) weathered rocks and the rock layers beneath it.
The two groups have different engineering and hydrogeological characteristics. The first group is on the top, hard and comparatively impermeable; the second group is under laid beneath the first group and it is more permeable.
Generally, the resistivity decreases with the depth because the first group is dry with low water content possibly due to its exposure to the sun (insolation). The period of study was at the beginning of rainy season, so the free ground water sur- face is at almost lowest level, that is, the soils or rock layers are in the driest condition. It is the reason for the high resistivity of the top layers. The thickness of the first group is 7-10m in most of the parts along the dam axis. The resistivity of the second group is obviously lower, which shows that much groundwater exists in this layer. In this layer, the lowest resis- tivity zones indicate that there are some parallel permeable and groundwater-rich zones with steep boundary, which indi- cates that the groundwater are comparatively rich along the fracture zones or faults with steep dips. This phenomenon coincides with the geological structure pattern shown by the lineament maps. This might be the main seepage paths be- neath the dam foundation.
The bedrocks of the dam site are mainly composed of shales and mudstones. It could be thought as same kind of rock. It appears true from the results of the geophysical surveying profiles because there is not much difference in resistivity fea- tures for the second group.
5. CONCLUSION
This study provides an integrated resistivity imaging survey and RS/ GIS approach to dam axis/foundation studies in Otobi area of southeastern Nigeria in order to establish the rock type which make up the foundation, the geological struc- tures of the foundation, overburden thickness, concealed basement morphology, fractures /seepage channels in the subsurface thus, enabling the evaluation of the suitability of the proposed dam foundation. The study revealed that two rock types exist in the subsurface. The first group consists of the top soil which consist of alluvial and residual soils or completely (and part of highly) weathered shales and mud- stones near the ground surface with a resistivity value of 8-100 ohm.m and the second group with resistivity value of 5- 50ohm.m consist of moderately (and part of highly) weathered rocks and the rock layers beneath it. .The geophysical survey also revealed the presence of so many parallel fractures in the subsurface rocks which may serve as seepage paths for the proposed dam. The geological mapping showed that the study area is underlain by the Nkporo shales and the Otobi Sand- stones. Most rock outcrops in the study area are weathered and displayed a high degree of fracturing. The lineament studies corroborates the results of the geological and geophysical investigation, as it also indicated that the proposed dam foundation is dominated by fractures and this might be detrimental to the dam as these fractures might serve as seepage paths/channels for the impounded water. This study also revealed the presence of intersecting fractures which might be a good source of underground water recharge for the dam. A detailed fracture characterization of the dam site is recommended so as to ascertain the nature of the fractures so as to discern the most appropriate grouting technique to be employed to avert seepage. The drainage map produced from the satellite image pointed out that some of the river tributaries considered in locating the dam axis are now extinct and con- sequently the dam axis should be adjusted accordingly to cover the tributaries that are still active.
 ENGLISH
 Chinese
 Russian

