Explore subsurface characterization by 1D resistivity vertical sounding method in Kenya
Abstract
Nairobi City is located in an area that may have been part of a large lake or a series of lakes that extended from Ol Doinyo Sabuk to almost Kajiado in the Tertiary Period. The volcanic rocks deposited in these lakes vary in lateral and vertical extent and in strength. Geotechnical investigation of sites with high variability by use of boreholes can be very costly. Electrical resistivity surveys are cheaper and quicker. The investigation program in this study involved 1-D geophysical resistivity surveys carried out at 48 sites with electrode distances ranging between 80 m and 500 m. The focus of the study was on how site investigations can be carried out cheaply and quickly in the context of design of heavy buildings and in underground excavations. Results for the resistivity survey are presented as log-log curves for the various sounding sites alongside the borehole logs while fractures traced in the borehole logs are indicated on a map. The results of this study indicate that the Nairobi subsurface consists of five different profiles with strata having resistivity values in the range of 4.3 Ohm-m to 480 Ohm-m. Though similar, the number of layers detected in each profile is variable. In areas dominated by clays or alternating layers of weak and strong materials, the resistivity values are less than 65 Ohm-m. Electrical geophysical resistivity can be used to determine stratigraphic information at a site in order to detect any variation that can pose challenges in building structures that can stand the test of time.
Key words: Nairobi City, Variable soils, subsurface characterization, Electrical Resistivity, Underground Excavation
Introduction
Nairobi City is located in central Kenya (Figure 1) in an area that may have been part of a large lake or a series of lakes that extended from Ol Doinyo Sabuk to almost Kajiado in the Tertiary Period. It is underlain by rocks erupted by volcanic processes within and around the East African Rift Valley. The geological succession includes metamorphic and igneous rocks as well as interbedded lacustrine and alluvial sediments. The subsoil in Nairobi City is reported to have variable strength and thickness at building sites and water borehole locations by Gevaerts [1], Sikes [2], Saggerson [3], Ministry of Works [4] and Ministry of Works [5]. The variability in strength has a bearing on the design of heavy buildings and in underground excavations [4].
Numerous studies have indicated that the greatest element of risk in an engineering project lies with the uncertainties in ground conditions ([6]; [7]; [8]). The risks are significantly increased with inadequate site investigations resulting in unpredictable construction costs and programming [9]. Consequently, site investigation forms a vital part of a building design, yet, in general, the scope of such investigation is constrained by financial and time considerations [10]. Geotechnical investigation of sites with high variability by use of boreholes can be very costly. Electrical resistivity surveys are cheaper and quicker. Geophysical resistivity survey has a high potential for delineating soft spots for further investigation because soft spots could have lower resistivity than the surrounding area covered by lava.
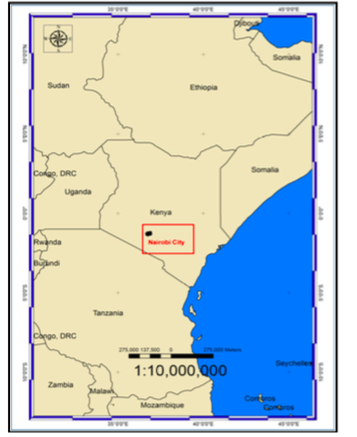
Figure 1: Map showing location of Nairobi City on the regional map of Africa.
Geophysical resistivity survey is based on the response of the earth to the flow of electrical current passed through the ground by use of electrodes. Electrical resistivity is a measure of the average resistance along the path travelled by the current. Electrical resistivity of earth materials is influenced by factors such as rock/soil type and degree of weathering/ consolidation, water content and salinity among others. It is therefore assumed that changes in resistivity values correspond to changes in the subsurface character. Resistivity survey gives a more detailed image of the subsurface than boreholes when carried out at several locations within a site. The depth for which the information can be obtained is determined by the size of the site; more than five profiles can be obtained for a site within a day in a 1-D survey. However, the method has not been extensively used in subsurface characterization for the purpose of construction in Nairobi City.
Materials and methods
The investigation program in this study involved 1-D geophysical resistivity surveys carried out at 48 sites with electrode distances ranging between 80m and 500m. The focus of the study was on how site investigations can be carried out cheaply and quickly in the context of design of heavy buildings and in underground excavations.
Geological research prior to starting of the geophysical study identified a network of faults in the south-western section of the project area (Figure 2) which are predominantly trending NNW and the soft spots that had been geologically identified in past reports (1; 2; 3; 4; 5; 11). Fracture zones were identified in borehole logs because deeply weathered rock associated with fracture zones causes numerous drilling problems including caving conditions, loss of drilling fluids and difficulty with drill bit rotation [12]. Other indicators include abnormally large unconsolidated zone, high moisture content in the unconsolidated zone, highly weathered bedrock, presence of iron staining and authigenic minerals (such as calcite) on fractured rock surfaces, and increases in water yield with depth [13].
The purpose of fracture trace analysis in this study was to: analyze structural jointing and fracture trends and their possible association with abrupt changes in soil type at construction sites and boreholes; determine weak areas that support structures; and, assist in evaluating if fracturing and jointing trends observed on the surface are present at depth within on-site boreholes [12]. Approximately, 900 borehole logs were analysed for fracture traces of which 97 had one or more of the indicators of fracturing. Positions of the boreholes with fracture trace indicators were plotted on the geological map using Didger 4 software (by Golden Software, Colorado) and those aligned were taken to represent fractures as shown in Figure 2. Vertical electrical sounding was then carried out either on the fault line/trace or across it in order to analyse subsurface variation.
The second stage involved identification of suitable sounding sites and seeking permission from relevant authorities to use the site on a specified day. The sounding centres were selected based on the location of soft spots and lineaments and on the availability of space for carrying out geophysical resistivity survey. A number of the sounding centres were located adjacent or near well logged boreholes so as to determine the correlation between the geophysical attributes and the hydrogeological and mechanical properties of the subsurface [14]. Stratigraphic profiles in the logged boreholes were drawn using Strater 3 Software (by Golden Software, Colorado USA). The stratigraphic profiles and the corresponding resistivities were used to identify soft spots in the subsurface and to provide a geologic context for evaluating the results of geotechnical investigations.
The geophysical resistivity survey was conducted using a WDDS-1 Digital Resistivity Meter in China. WDDS-1 resistivity meter is a new generation of resistivity instrument that can automatically measure and store parameters such as self potential, current, voltage, geometric factor and apparent resistivity. Vertical electrical sounding (VES) was carried at centres located in open/sports fields, public institutions or along straight portions of roads away from the power lines and water mains. Each sounding centre constituted a vertical sounding (VS) and designated VS-1 through to VS-48 as shown in Figure 2. The sites are labelled along south-north lines in the west-east direction beginning with VS-1 through VS-48. The location of each sounding station was recorded in degrees using Garmin 12 channel personal navigator Global Positioning System (GPS). The Schlumberger array was utilized to carry out the resistivity survey with electrode separations from the centre (AB/2) ranging between 80m and 500m. Schlumberger technique was preferred because it provides for high signal-to-noise ratios, good resolution of horizontal layers, and good depth sensitivity [15].
The apparent resistivity (ρ) values obtained for each survey line were plotted against AB/2 on a log-log plot using Earth ImagerTM software. The Earth Imager software is manufactured by Advanced Geosciences Incorporated (AGI) of Texas USA for inversion of geophysical resistivity data. Once the data is transferred to the program, the software automatically detects borehole data set for processing. From iteration to iteration “bad” data is removed and the data misfit is displayed in a scatter plot. There is also a data cross plot (raw versus inverted apparent resistivity data) available as well as a diagram showing the convergence curve and layer model for the subsurface. The root mean square error (RMS) is also indicated on the diagram. Analysis of variation in the subsurface character using the resistivity curves was attained through curve marching. Curve marching involves comparison of VES curves obtained in a resistivity survey with Master Curves obtained from past experimental studies. The comparison is based on the values of apparent resistivity of the geoelectric layers detected in a resistivity curve. The Master Curves include: H type where ρ1> ρ2 < ρ3; K type where ρ1< ρ2 > ρ3; A type where ρ1< ρ2 < ρ3; and, Q type where ρ1> ρ2 > ρ3.
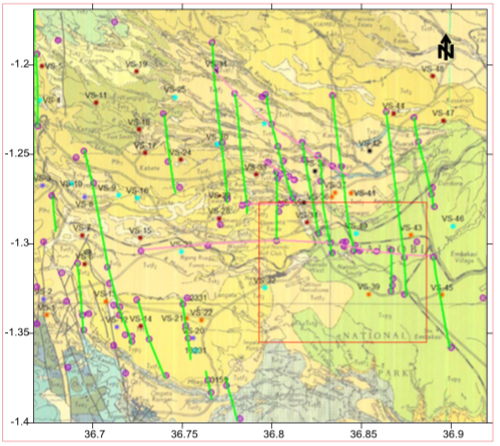
igure 2: Map showing vertical electrical sounding sites (stars), positions of boreholes with fracture traces (purple circles), fractures traced (green and pink), and, outline of the Nairobi City Centre and immediate environs (red rectangle) (Saggerson, 1991)
Results and discussion
Results for the resistivity survey are presented as log-log curves for various sounding sites plotted on Earth Imager software. On marching the curves for various VES sites, it was observed that where the subsurface profiles are similar, the resistivity curves have a similar shape. However, on closer scrutiny of the curves, it was noted that even when the curves generally look similar, the subsurface is basically heterogeneous as indicated by the difference in the number of geoelectric layers detected. Because of the heterogeneity of the subsurface, none of the curves could march one type of Master Curve. Five shapes of curves were obtained for the entire study area.
Several fault traces were mapped in boreholes in the vicinity of Nairobi City as shown on Figure 2. The traces indicate that the City Centre subsurface may have been affected by two sets of faulting: NW-SE and E-W. One NW-SE fracture trace at the City Centre affects the Nairobi Trachyte that is prominent at Upper Hill area but is not encountered beyond Uhuru Highway. A borehole at the Latter-Day Saints church at Lower Hill encountered a small thickness of the Nairobi Trachyte but BH C-1987 at Uhuru Highway railway crossing did not encounter it, showing that it suddenly ends within the Railway Golf Club.
The second City Centre fracture trace is observed at Uhuru Highway railway crossing through Moi Avenue line to the Premier Academy borehole at Parklands that has exceptionally high yield like BH C-1987 at railway crossing. The third fracture trace is mapped in several boreholes in Industrial area and emerges at the Railway Station and can be observed as far north as Muthaiga where distress in structures is reported. Given the three faults cutting through City Centre in the N-S direction, the parts covered with deep soft soils seem to represent a graben while those covered by tuffs represent the horst. The E-W faulting is represented by Kenyatta Avenue-Valley Road where there are different subsoil types on either side of the road. The other important fracture traced is that along Ngong’ Road where deep soft soils are encountered in construction excavations. Aquifers and rest levels are very deep along Ngong Road. Engineering consultants for the NSSF building at Upper Hill also reported encounter of sudden voids within very competent Nairobi Trachyte.
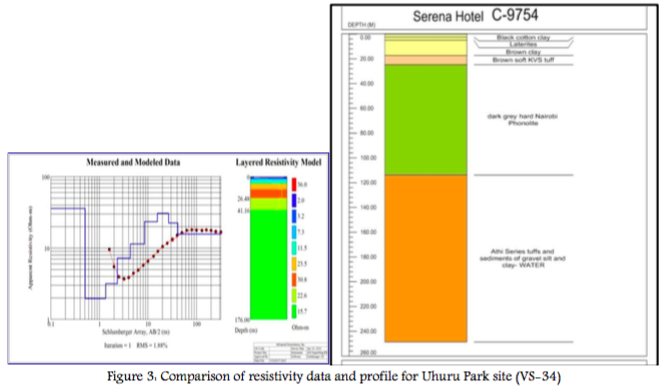
Majority of the VES stations was concentrated in those areas that have known weak materials or nearby faults or fault traces. Uhuru Park site (VS-34) at the City Centre recorded low resistivity values ranging from 4.3 to 36.0 Ohm-m; the resistivity reduces from 36 ohm-m at the surface to a low of 2.5 ohm-m at 4m depth (Figure 3) indicating the dominance of weak materials. This corresponds well with the core logs recovered from several geotechnical boreholes at Serena Hotel and Uhuru Park Dais and a water supply borehole at Serena Hotel (C- 9754). The succession in the geotechnical boreholes starting from the surface to 15 m depth includes black cotton soil, soft yellow tuff, flesh black tuff and weathered agglomeratic tuff. Alternating layers of clays, weathered and fresh trachytic tuffs are encountered in the water supply borehole. Given that the water supply borehole was drilled by percussion while the geotechnical boreholes were drilled by rotary with full core recovery, the geotechnical data is more reliable. Seventeen Sites with curves of similar shape as the VS-34 (HAKQ type) are indicated in the same colour on Figure 2. Lightweight structures with shallow foundations located on these sites have shown some distress while heavy buildings located on the black tuff are stable. Because of the small thickness of the black tuff and the concept of suppression, it is not easy to detect it on the resistivity curve. Caution should be taken when designing structures in these locations.
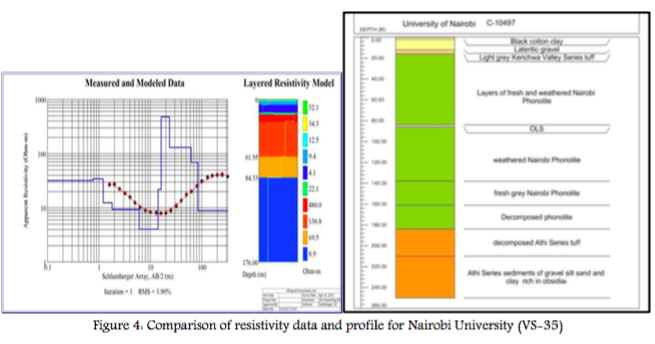
The second shape of curve obtained is KHQ type represented by the curve for University of Nairobi Sports Field (Figure 4). The sounding curve shows that resistivity reduces with depth and reaches a low of 4.1 ohm-m at 15 m depth before it begins to rise. This rise is within the lateritic gravel in borehole C-10497 in the vicinity of the site. The resistivity is high within the fresh Nairobi Phonolite which from geotechnical tests is known to be very strong. The resistivity drops within the weathered Nairobi Phonolite and Athi Series just at the bottom of the Old Land Surface at 84 m. From borehole records, aquifers were struck within the weathered phonolite and the Athi series formations below 84 m depth. A core log from Boulevard Hotel in the vicinity indicates other aquifers at 150-162 m and at 204-323 m, correlating well with the resistivity value of 8.9 Ohm-m. Only three sites have this shape of curve and historical records indicate that they may have been swamps filled with construction rubble from elsewhere.
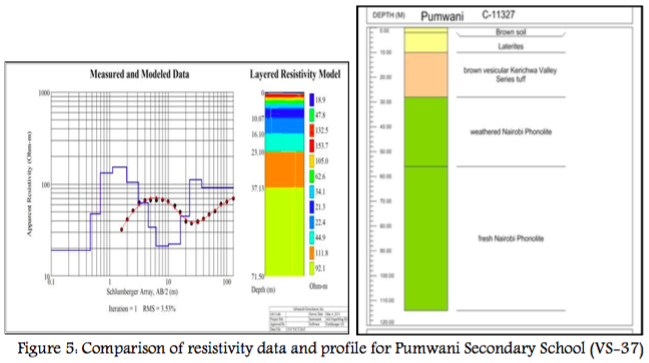
The third shape of curve obtained is the AHKA type represented by a sounding curve and subsurface profile for Pumwani Secondary School sports field. Resistivity of the four near-surface geoelectric layers increases with depth. In some logs from nearby boreholes, these layers are described as decomposed tuffs while in others they are described as laterites. A geotechnical borehole log at a nearby site indicates that the laterites extend to 8 m depth and are underlain by weathered Kerichwa Valley Series tuff. The lower resistivity geoelectric layers between 10 m and 23 m on the resistivity model in Figure 5 represent vesicular Kerichwa Valley Series tuff and the weathered Nairobi Phonolite beneath it. From records, the first (minor) aquifer in the water supply borehole was struck at the contact between the Kerichwa Valley Series and the weathered Nairobi phonolite. Ten sites with curves of similar shape as VS-37 are indicated in the same colour on Figure 2.
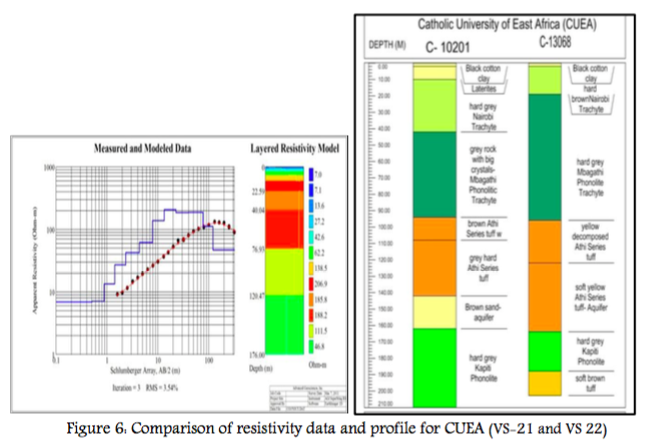
The fourth type of curve obtained is AKQ type as represented by Catholic University of East Africa (Figure 6). The sounding curve in Figure 6 shows that the resistivity increases with depth. The layered resistivity model shows that it increases up to 77 m within the Mbagathi Phonolitic Trachyte and is high (111.5 Ω-m) within the upper part of the Athi Series. Then at 120 m depth, the resistivity drops from 111.5 Ω-m to 46.8 Ω-m. It can be observed that water was encountered at depths of 130 m and 170 m within the Athi Series as indicated in the two borehole profiles. The resistivity therefore drops as the groundwater is approached. Eight sites with curves of similar shape as VS-43 are indicated in the same colour on Figure 2, most of them in east Nairobi and Karen- Langata.
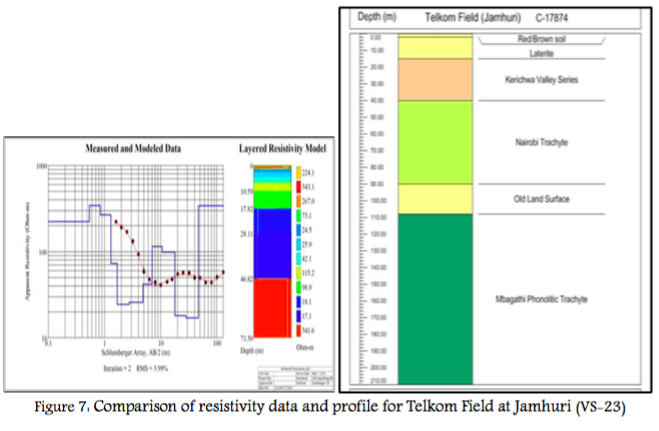
The fifth shape of curve was obtained at 11 sites and is represented by Telkom Field at Jamhuri in Figure 7 (AHKQ type). Borehole profiles indicate existence of red soil at the surface followed by laterite and weathered tuffs. The layered resistivity model indicates that the laterite has variable strength ranging between 24.5Ohm-m to 95 Ohm-m. The resisitivity of the Kerichwa Valley Series Tuff lies between 17 and 18 Ohm-m; the first aquifer was struck within this formation. There is a drastic increase in resistivity within the Nairobi Trachyte. This is consistent with the mechanical properties of the Nairobi Trachyte as recovered at Upper Hill geotechnical sites. The layered resistivity model was not able to “detect” the behavior of the Mbagathi Phonolitic Trachyte, however the value of aparent resistivity was about 350 Ohm-m.
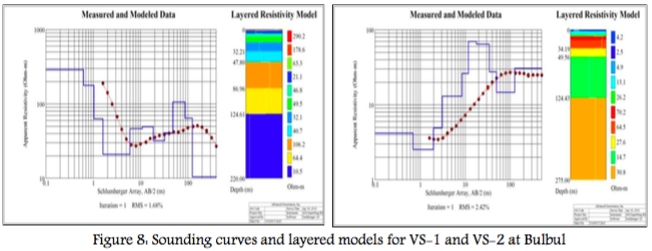
Two VES were carried out at Bulbul, one line running across the fault (VS-1) the other line running along the fault (VS-2) as shown in Figure 8. The near surface layers along the fault have the resistivity values below 5 ohm-m up to 5 m depth and less than 30 ohm-m up to 30 m depth. The resistivity variation along the fault forms shape of curve almost similar to that obtained at Uhuru Park site (Figure 2 VES-34), however, the depth of the weaker materials is large. Five sites with such deep weak subsurface as VS-2 are indicated in the same colour on Figure 2 and are associated with cyclic distress in structures. Across the fault, the resistivity forms a curve that is almost similar to that obtained at Telkom Field at Jamhuri in Figure 7. where the resistivity value of 290 ohm-m at the ground surface gradually reduces to a low of 21 Ohm-m at 7 m depth after which it rises and falls to 10 Ohm-m.
If the two layered resistivity models for Bulbul (Figure 8) are compared at 49.56 m and 47.8 m, they have resistivities of 14.7 ohm-m and 106.2 ohm-m respectively. This indicates that the subsurface varies in the two directions owing to the presence of the fault. But the two Bulbul curves agree at depths below 124 m where there is a low resistivity layer indicating saturation. A nearby borehole drilled during the period of this study (C-17994) encountered Athi tuffs and old land surface sediments at 120-178 m. The major aquifer was encountered within the old land surface sediments. The borehole log profile agrees more with the resistivity model across the fault where the Athi tuffs and old land surface appear as one geoelectric layer.
Conclusions and Recommendations
The resistivity curves obtained in this study can fall under any of the following:
i) Profiles where resistivity increases with depth but is in general between 4 Ohm-m and 30 Ohm-m.
These are areas within fault zones or nearby fault traces where distress in structures is often
reported;
ii) Profiles where resistivity decreases with depth to a low at about 10 m, then rises but remains below
40 Ohm-m.
iii) Profiles where resistivity increases with depth, falls and then rises but remains below 70-ohm-m.
iv) Profiles where resistivity increases with depth to about 100 m and then starts to fall. The resistivity
values are within the range of 10 Ohm-m and 350-ohm m. v) Profiles where resistivity decreases with depth within the overburden, rises within the underlying laterites, falls at the base of laterites where water is encountered in boreholes. It then keeps rising and falling due to the presence of alternating weathered and fresh rock.
This study also traced faults in boreholes to determine their possible association to soft spots and to the variation of the character of subsurface materials in boreholes and at building sites. Twenty three (23) fault traces were delineated in water supply boreholes. The nature of fault traces in the wells indicates that they are concealed underground. The results show that the traces are dominated by clays or alternating layers of weak and strong materials. The resistivity values of these materials are generally less than 65 Ohm-m. Resistivity survey can therefore be used to confirm the presence of faults at sites for heavy construction or underground excavation if the electrode spread is done along and across the suspected faults.
In general, the results of this study indicate that the Nairobi subsurface consists of five different geoelectric profiles with strata having resistivity values in the range of 4.3 Ohm-m to 480 Ohm-m. Though similar, the number of layers detected in each profile is variable. In areas dominated by clays or alternating layers of weak and strong materials, the resistivity values are less than 65 Ohm-m. Electrical geophysical resistivity can be used to determine stratigraphic information at a site in order to detect any variation that can pose challenges in building structures that can stand the test of time.
 ENGLISH
 Chinese
 Russian

