Investigation of Buried Caves Using Resistivity Imaging Method at Construction Site of Riverside
Abstract :
The building site developed along the river in Sanmenxia city of province Henan; The construction site surveyed by 2D Resistivity Tomography method. The exact locations, buried depths,
water-bearing states and size of the cavities were found out, which indicate that 2D Resistivity Tomography surrey is an effectual method in practice for probing the buried cavities. If there is no water in the cavity, the anomaly would appear as a closed circle with high impedance in the 2D resistivity image. In contrast, the anomaly would manifested as a closed circle with bow impedance if there is water in the cavity.
Key words: buried cavity; excavated-empty-area; Electrical Resistivity Tomography(ERT); Sanmenxia city
1 Introduction
The space formed by excavating up underground layers is called as an excavation area. After the excavation area occurred, the overburden layers would lose the support, which would move and distort the overburden layers because original equilibrium conditions were broken. And the overburden layers would subside, Finally which results in sinning of extensive ground and damage of various buildings on the ground.
The excavation area seriously imperils the safety to the lives and properties of people, industrial production and buildings nearby. So, to probe the excavation-area has become an important research project.
In order to find out the hidden geological hazards, we have carried out the Electrical Resistivity Tomography (ERT) survey in Sanmenxia city. In the paper, the application of ERT survey to prospecting caves in sand-layer is presented by the results of ERT survey performed along Qinglongjian River in Sanmenxia city of province Henan.
2 Exploitation and harness in the excavation-area along Qinglongjian River
in Sanmenxia city Qinglongjian River runs through Sanmenxia city, and has become a seasonal river as times goes on. In dry season, a large amount of river sand were digged during 1980’s~1990’s, which produced many buried cavities on abandoned riverbed. These buried cavities have been influencing seriously on development of Sanmenxia city. Early 2000’s, the government in Sanmenxia city put forward a grand prospects to harness and developing Qinglongjian river area in Sanmenxia city. Therefore, to find out the buried cavities has become an important task.
3 Introducing to Electrical Resistivity Tomography (ERT) Survey
3.1 Survey principle and method
1) Fundamental principle : When performing survey, all electrodes are set on the measuring points at a certain space, then are connected to a program-controlled electrode multiplexer by a cable. To lay on the electrodes is completed once. The operations are controlled by the program so that electrode array type, electrode spacing and measuring points can be transformed quickly, large amount of data can be acquired speedily and precisely during survey. The collected data are processed in various ways by the series of advance electric processing software that are necessary accessories for the survey system, and the produced results are displayed as graphics directly, which facilitates explanation. The principle of ERT survey belongs
still among DC electrical survey.
2) Instruments The WGMD-2 high density resistivity survey system consists of two parts: WJDJ-2 digital multifunction DC exciting-current instrument, as a main monitored control equipment, two WDZJ-2 electrode multiplexer. The leading features of the system are as follows: 1) To lay out electrodes is completed only once; 2)the parameters for the multi-type-array of the electrodes can be determined effectively , so that more information about the ground electric and recorded automatically; 4) the data can be processed in real time and off line mode. As compared with the conventional electric resistivity surrey, the ERT is of the advantages of the lower cost, the high efficiency, a wealth of information, facilitating explanation and improved obviously prospecting capacity.
3) Field survey method
The fix profile scanning is generally used in field survey with á-type array (Wenner spread AMNB),â-type array (dipole array ABMN),ã- type array (Difference array ABMN), or triple-pole array.
When performing survey, the 60~120 electrodes that can be used as both the powering electrodes and measuring electrodes data laid-out along surrey line at constant spacing at a time, and are connected to the multi-plexer with the multi-ware cable. This scanning survey can be completed for the electrode array types. Pole spacing and measure points under the control of main-equipment. A single measuring can collect data from 552~2340 measuring points along the 16-39 sections under the fix profile. The analysis indicates resolution, the array type is an important factor influenced resolution. The differential Setting would produce the least anomalous amplitudes and early oscillation. The better oscillation and no large anomalous amplitudes can be acquired with Wenner (Four-pole) array. For the dipole-dipole array, the anomalous amplitudes are large relatively, the resolution is more high, but the oscillation is very strong, even the low resistance anomaly occurs over the body with high resistance, contrariwise. There are different resolutions and probing depths for the various targets by the different setting . The dipole collecting system is suited for the shallow prospecting, and the Wenner array is appropriate to the deep exploration, with respect to the high density resistivity method. The Wenner array has the certain superiority in the environment with the poor grounding conditions and the serious powered interfere. [1]
To perform ERT survey in the concentrated buildings area, the key techniques must be resolved, such as the injected current is as enhanced as possible, to avoid the industrial current interference (especially underground cable) in city as far as possible. The difficulty in the laying out electrodes caused by the pavement roads can be resolved.
4) Data process and software
The data processing technique is one of the important ways to improve resolution. In order to increase explanation accuracy, the RES2DINV least squares method inversion program is used for the forward and inversion computation. The high-pass and low pass filtering are carriede out so as to remove and reduce the interferences and the oscillation caused by the surface layer and polarization, respectively based on the geo-electricity, the equipment system and the analyzing forward simulation results.
5)· The RES2DINV least Squares Method software
The data were processed by using the RES2DINV Least squares Method inversion program designed by Doctor M.H.Loke The program is suitable to inversion of resistivity data collected with the Wenner array (á.â.ã.),dipole-dipole(AB-roll) pole-dipole(A-MN roll, MN-B roll, A-MN rectangle) bi-pole(A-M roll). Schlumberger array (á-array, four-pole role Sounding), and so on. The large amount of data set(about 100-5000) acquired from 25-650 electrodes can be inverted simultaneously by the program.
6)· GRAF4WIN and SURFER32 Software
The GRAF4WIN and SURFER32 software are all the common soft-wares. For the convenience of comparison, the graphics were drawn with both GRAF4WIN and SURFER32 software based on the actual data. In addition, other software, such as the BT-WYS software. RT/RT Mapper For Window etc can be used too.
4 Surrey Effect
4.1 Early surveying Test
The ideal results were not obtained by the shallow seismic prospecting (reflection, refraction). Ground Penetration Radar and the conventional electrical survey, and so on. Analysis indicated that the factors resulted in the failure are mainly as follows:
(1)For the shallow seismic prospecting (reflection, refraction), The factors caused failure are that the forms of the cavities are irregular, some cavities were wide and another narrow. In addition, there were not the obvious ware impedance interface and the difference in ware velocity between the sand layers. The rough engineering sites brought on a certain error in the measuring and explanation, too.
(2)For Ground Penetrating Radar(GPR),the causes for the failures are that the buried depth of the cavities are deeper(generally 4~15), but the optimal probing depth is lower than l0 m usually for the GPR, and the rough site is also one of factors.
(3)The conventional electrical survey has obvious defects. The measuring points are more sparse in the conventional electrical survey because it is restricted therefore, it is difficult to study the structures.
But in the array type it is better, the distribution of the electrical sections from an array type of the electrodes.
4.2 2D ERT Results
Three building sites with the potential sand cavities in the development area along Qinglongjian River
were prospected for three times by ERT, and the good effects has been acquired.
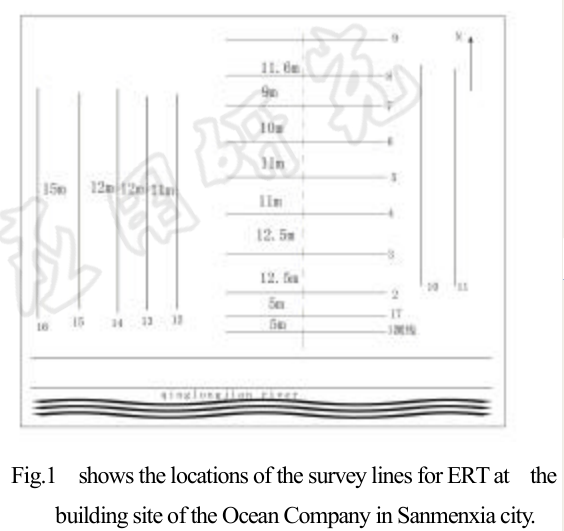
(1)To lay out surrey lines : The locations of the surrey lines for ERT completed at the building site of the Ocean Company in Sanmenxia city are shown in Figure 1. 2D survey lines were laid out in jump-mode in both longitude and latitude directions. In this configuration, the maximum distance is 12.5m,and minimum 5m between surrey lines, and the maximum spacing is 2.0m, minimum 0.5m between measuring points.
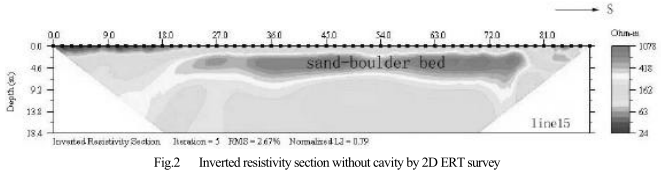
(2) 2D inversion results with out sand cavity: Fig.2 shows the inverted resistivity section without cavity by 2D ERT. It can be seen that the surface layer is land fill with the lower resistance, the layer immediately below it is high-resistance layer that reflects the sand-boulder bed; the sand layer with water. Which appears as low resistance, is at the bottom. Based on the results obtained by the rock-soil geological prospecting, the depth of the Sand-boulder bed is about 6.0 9.0m in the area. Besides the Sand-boulder bed, there are roller-stones with maximum size of 2.0m 2 . It can be seen from Fig.2 that the resistivity is homogeneous transversally along the section and no evidence of the sand cavities is shown.
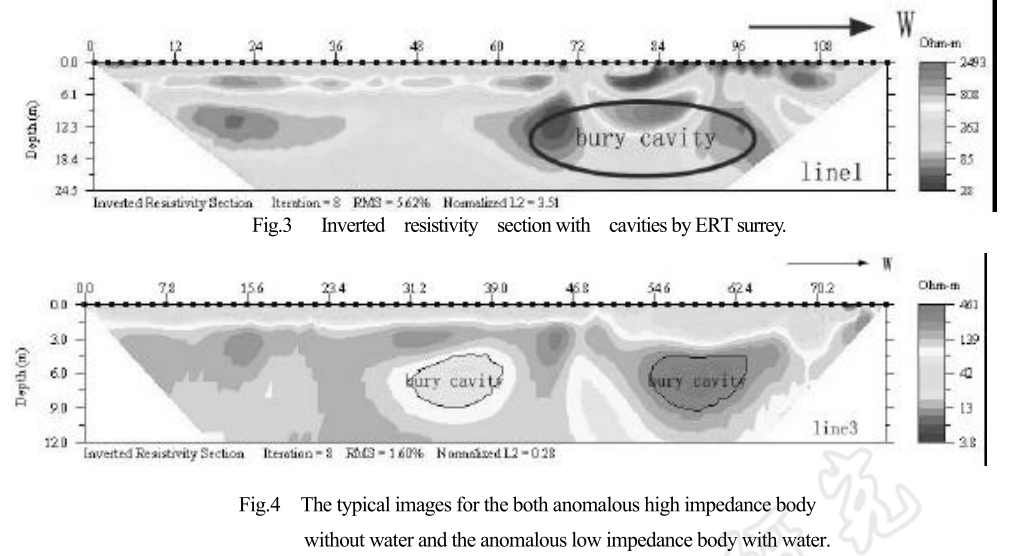
(3) 2D inverted section with cavities
2D inverted resistivity section with the cavities is shown in Fig.3. It can be seen that the boulder bed is discontinuous as affected by digging sands, Especially between the stakes 74 and 96, there are the mixed anomalous body that is consisted of two low anomalies and one high anomaly between them. The digging identified that the mixed anomalous body is a cavity with about 20.0m long and 12.0m depth of the bottom interface.
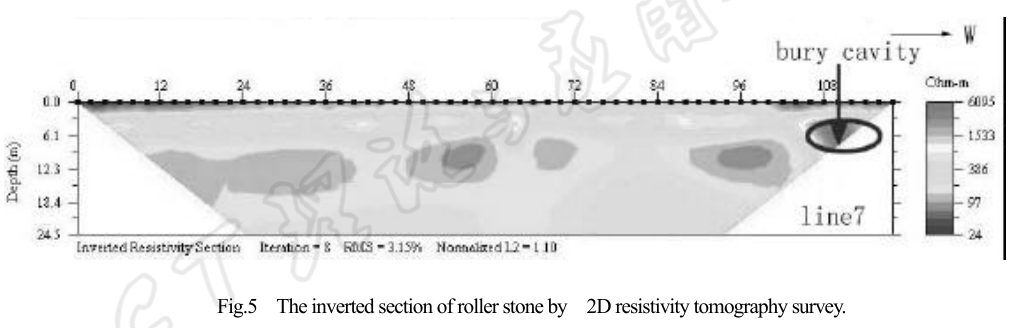
The inverted section for the survey line3 is displayed in Fig.4. In can be found that the cavity without water appears as a closed circly with high resistance anomaly generally. In contrast, if there is water in the cavity, the anomaly would appears as a closed circly with low resistance. The digging shows that the fact corresponds with the inverted results.
Fig.5 Shows an example of the inverted result and the digging for the roller stones. The anomalous forms are simple small separate closed circlies with high resistance because of the small sige of the roller stones.
5 Conclusion and Discussion
5.1 Conclusion
The following conclusions can be made based on the computation and analysis described above:
(1) 2D ERT is feasible and accurate to probe and position the cavities in the digging sand area.
(2) The cavities without water would appear as the anomalous closed circles with high resistance; If there is water in the cavity, the anomaly would appears as the closed circle with low resistance.
(3) The roller stone with a certain size can be probed and located, The apparent resistivity would shows high resistance anomaly.
 ENGLISH
 Chinese
 Russian

