Effects of Seismic and Geotechnical Parameters on Microzoning and Their Correlations (Turkey)
Abstract
This study focusses on the effects of geotechnical and some seismic parameters on construction in Denizli city center where commercial and residential buildings are very dense. Standard Penetration Test (SPT) N blow number, shear wave velocity (Vs), soil amplification and dominant soil vibration period were measured. They demonstrate that the central and northern parts of the study area have lower seismic and geotechnical characteristics than the others. The most common soil period is around 0.5-0.7 sec that overlaps with periods of many buildings in the area. The period of soil and/or structure should be modified for an earthquake resistant building design. The correlation between SPT-Vs and SPT-soil amplification were parallel to the early studies. They can be employed to predict the other geotechnical parameters.
Keywords: soil amplification, ground vibration period, geotechnics, SPT, seismic
Introduction
A significant number of people lives seismically risky areas in Turkey where lies on Alpine- Himalayan tectonic belt. Therefore, the earthquakes cause loss of life and property and impend against sustained development. Engineering supervised construction is required to mitigate or eliminate this risk and threat. In this context, soil amplification and ground vibration period are noteworthy dynamic parameters for an earthquake resistant design.
Seismic waves emitted from the hypocenter are not uniform during its travel through the rock units. They are controlled by earthquake (duration, hypocenter depth, fault type, rupture length etc.) and geological characteristics (rock and soil types, folds, discontinuities, layers etc.).The amplitude of the waves increases as they travel from stiff to soft units. It is called soil amplification and responsible from many building damages. There are a numerous number of studies on that (Seed, Romo, Sun, Jaime &Lysmer, 1988; Bray, Seed, Cluff& Seed,1994; Charles, Aladdin, Onder & William,1997; Motamed, Ghalandarzadeh, Tawhata & Tabatabaei, 2007; Meslem, Yamazaki, Maruyama, Benouar, Laouami & Benkaci, 2010).
Each material has its own oscillation period. In this way buildings and soils have their unique periods. Microtremors are natural/artificial small ground vibrations and the dominant periods of soils and structures can be gained by using them (Naing and Pramumijoyo, 2012). The period is dependent on rigidity and/or mass of soils and structures (Khalil, Sadek&Shahrour, 2007). Dominant soil periods and related parameters have to be defined for an earthquake resistant design and they are regulated in building codes of many countries such as Japan, US, EU, Turkey, Iran and India(CEN, 2004; PAU/GEO, 2002).
This study is focused on resonance phenomena which is one of the major parameters for an earthquake resistant building design. The geotechnical and seismic parameters are crucial for an earthquake resilient city. Moreover, these parameters are correlated with each other to predict the desired one. Begin your paper with the introduction. The active voice, rather than passive voice, should be used in your writing.
Material and Method
Geological and Geotechnical Settings
The study area is downtown of Denizli city and it covers OnbesMayis, Altintop, Degirmenonu, Hacikaplanlar, Saraylar, Sirakapilar and Topraklik districts. Denizli is located in a seismically active horst- graben system that is at the east end of the Menderes Graben (Figure 1A). Quaternary aged fan delta deposits, alluvial units and Neogene aged terrestrial units outcrop in the area (Figure 1B). Geological and geotechnical studies include 18 geotechnical boreholes in which SPT tests have been performed and the soil samples have been collected for lab tests ;(PAU/GEO, 2002). The lab results show that there are units of clayey (CL), silty (ML), gravelly (GM) and more commonly sandy (SM, SC, SL).
MASW and Soil Amplification
Seismic waves are not in a one harmony and the damaging ones have frequencies between 0.1Hz and 10Hz. Soft soil sediments react differently to various frequencies. In other words, soil amplification depends on frequency. Some of them are significantly amplified though some others not. Soil amplification coefficient is commonly calculated by using shear wave velocity (Vs). Average Vs of 30 meters from the surface is measured by multichannel analysis of surface waves (MASW). The records were acquisited by WZG‒12A seismography which has 12 channels with 4.5 Hz vertical geophones. In the study area MASW data were recorded at 39 locations (Figure 1B). The amplification has been calculated by Equation 1 suggested by Midorikawa (1987)
A = 68Vs-0.6(V1 < 1100 m/s) [Eq. 1]
where;
A: Soil amplification factor,
Vs (m/s): Average shear wave velocity in 30 m from surface.
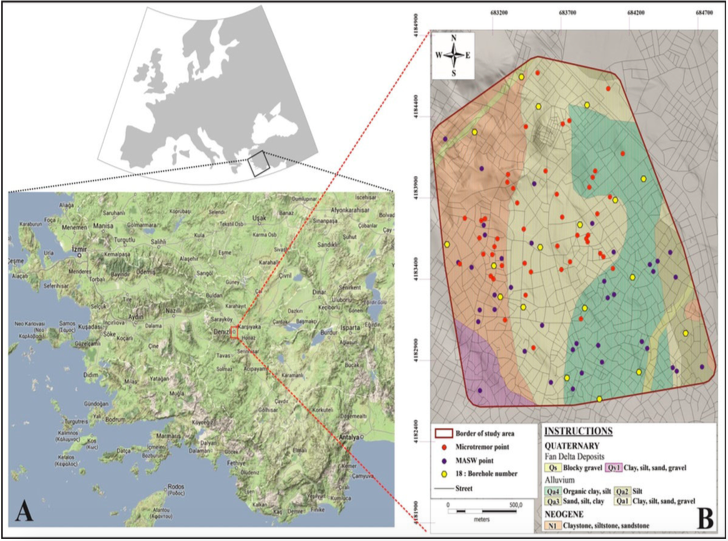
Figure 1.Location (Google) and geological map (PAU/GEO. 2002) of study area.
Microtremors and Dominant Soil Period
Microtremors in soil and construction are recorded as velocity, acceleration or displacement. They have three components: north-south, east-west, and the vertical and are generally assessed with Nakamura method. Nakamura (1939) has proposed a modified microtremor analysis referred to as the H/V method. It displays that the source effect can be minimized by normalizing the horizontal spectral amplitude with the vertical spectral amplitude. The horizontal to vertical (H/V) spectral ratio of microtremors approximately equals the S-wave transfer function between the bedrock and ground surface at a site. In other words, the H/V peak period and peak value itself correspond to the natural site period and amplification factor respectively. The Nakamura’s H/V spectral ratio (SR) is computed by Equation 2.
SR=[〖NS〗^2 (w)+〖EW〗^2 (w)]^0.5/(UD^2 (w) ) where;
SR: Nakamura’s (H/V) spectrum
NS(w): The largest amplitude in N-S direction EW(w): The largest amplitude in E-W direction UD(w): The largest amplitude in the vertical direction
[Eq. 2]
A seismometer (Güralp System CMG6TD‒1) has been used with three axis to record the microtremors and it logs velocity. Frequency response range is between 320μ Hz and 256μ Hz. The measurements have performed at 47 locations (Figure 1B) during 30 minutes. The Scream and The Geopsy software are employed to get and assess the data.
The geotechnical data display that SPT (N) number of blows are scattered in a wide range as between 3 and 50 (Figure 2a). The values are quite low at central and northern parts of the study area though the southwest is very high up maximum 50 blows. The shear wave velocities are not very high in the entire area expect the southwestern parts (Figure 2b). The distribution of the soil amplification factor is illustrated in Figure 2c. It demonstrates that the values are scattered throughout the study area. Dominant soil periods are commonly in the range of 0.5 and 0.7 seconds in the study area as shown in Figure 2d. Some great fluctuations are observed in the southwestern part of the study area.
Correlations and Discussion
The study has also focused on the relations between the examined parameters. A correlation between SPT and Vs is illustrated in Figure 3 with other eleven studies taken from Akin (2009). The result is parallel to the others and it lies between Athanasopoulos (1995) and Oshaki and Iwasaki (1973). A relationship between Vs and soil amplification is shown nearly linear results than Midorikawa (1987), Borcherdt (1994) and Ansal, Iyisan&Yildirim(2001) as seen in Figure 4. It should be approached with cautious. SPT and soil amplification relation is illustrated in Figure 5. The results came in line with the early studies.
Periods of soil and structure should not overlap to avoid resonance phenomena. In general speaking, period of each floor of a standard reinforced concrete (RC) building is 0.7 second and it may be higher for low rise buildings. The common building periods are 0.35, 0.40, 0.45 and 0.50 for 1, 2, 3 and 4 storied ones respectively. The obtained data suggest that the most common soil type overlap with buildings which have 4-7 storied. The buildings in the main streets are 7 storied while the ones on the small streets have 3-5 storied. It means there is a high resonance risk in the study area unless taking precautions. Altering soil rigidity is one of the most and economical ways to mitigate the risk.
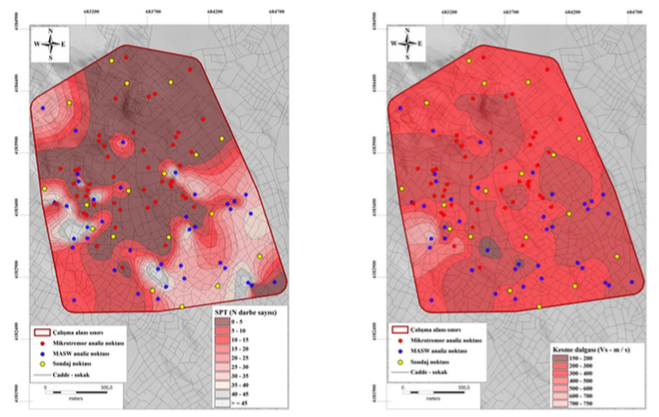
a) SPT (N) number of blows b) Shear wave velocity
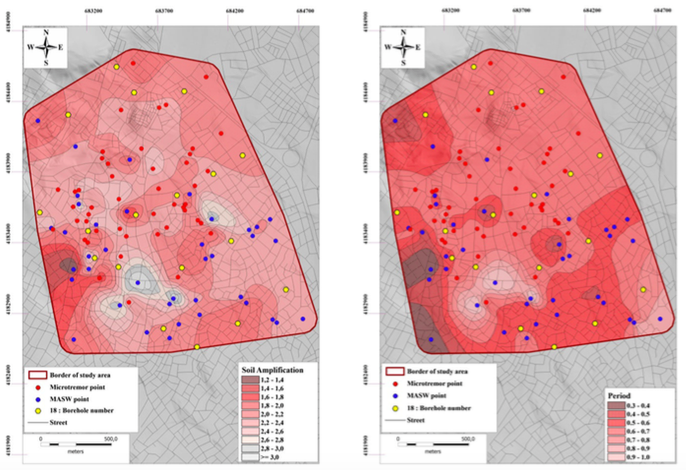
c) Soil amplification d) Dominant soil periods
Figure 2.Distribution of the in-situ parameters.
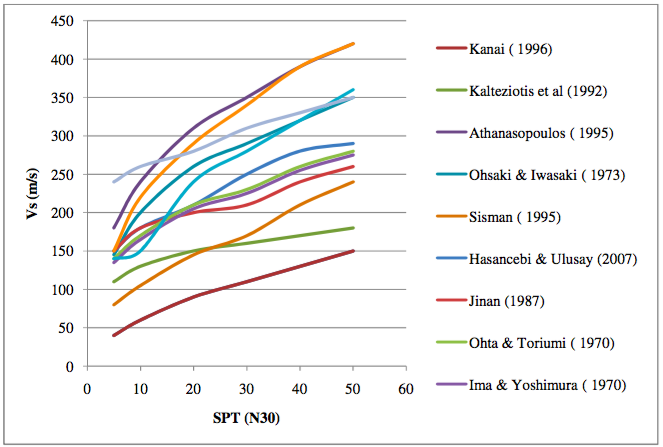
Figure 3.SPT–Vs correlations (other data from (Akin, 2009)).
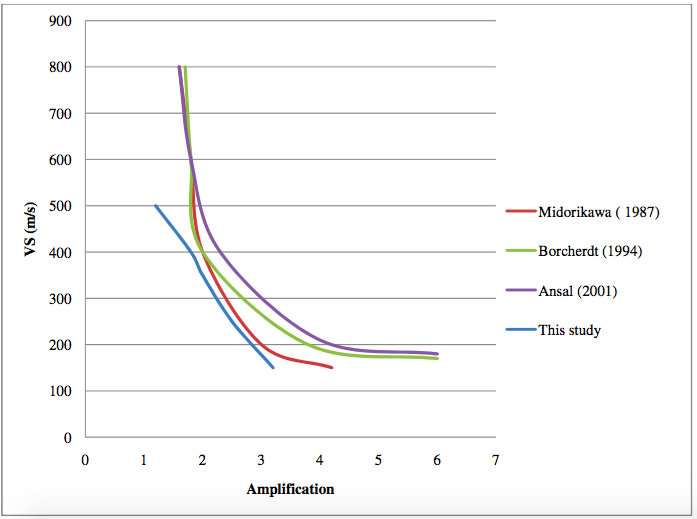
Figure 4.Vs-soil amplification correlation (other data from (Ansal et al., 2001).
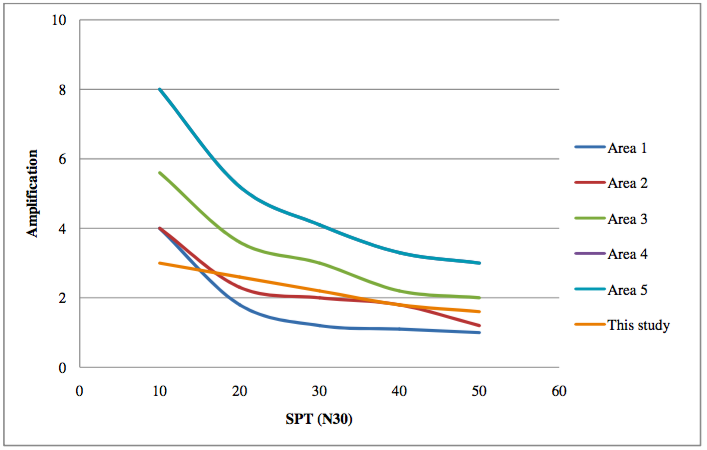
Figure 5.SPT-soil amplification correlation(other data from (Ansal et al., 2001).
Conclusions
The study area covers a part of Denizli downtown that is located in a seismically active horst-graben system at the east end of the Menderes Graben. Quaternary aged fan delta deposits, alluvial units and Neogene aged terrestrial units outcrop in the area. Seismic, geological and geotechnical studies have been performed. The laboratory results proved that the units are of clayey (CL), silty (ML), gravelly (GM) and more commonly sandy (SM, SC, SL). The geotechnical data display that SPT (N) number of blows were scattered in a wide range while they were quite low at central and northern parts of the study area. The shear wave velocities were not very high in the entire area expect the southwestern parts. The soil amplification factor values were scattered throughout the study area. Dominant soil periods were commonly in the range of 0.5 and 0.7 seconds in the area. The obtained period data suggested that the most common soil type overlap with buildings which have 4-7 storied. There was a resonance risk in the study area unless taking precautions. Altering soil rigidity is one of the most and economical ways to mitigate the risk. The correlation between SPT and Vs was parallel to the early studies. Vs and soil amplification relationship was nearly linear that was slightly diverted from the compared studies. SPT and soil amplification relation came in line with the early studies. The SPT-Vs and SPT-soil amplification correlations can be used to predict the parameters.
 ENGLISH
 Chinese
 Russian

