Electrical resistivity imaging tomography(ERT) method and seismic refraction method for Landslide investigation in India
The aim of this paper is to investigate landslide prone areas in Nilgiri hills which have caused damage to people and properties and to devise preventive steps to be taken in the events of future landslides. Our study area was situated at Ooty region, Nilgiri District, Tamilnadu. In this study we use the seismic refraction survey carried out across landslides located near the villages in Allanchi, Kundha, The 2D electrical resistivity imaging (ERI) surveys are acquired near the villages of katerri, Kunda. Topographic models of landslide surface are made for all three sites. Seismic and resistivity imaging method give detailed of the soil, lithomorphic clay and weathered gnessic rocks in the study area. In the study area there are two types of landslides; thin soil slides, and lesser rock mass slides. Landsliding in the study area can be caused by high rainfall and seismic activity. This case study focuses on paleo slides and look at predicting areas of future landslide in Ooty area.
Key words: Landslide, seismic refraction, 2D electrical resistivity imaging (ERI), resistivity, Ooty.
INTRODUCTION
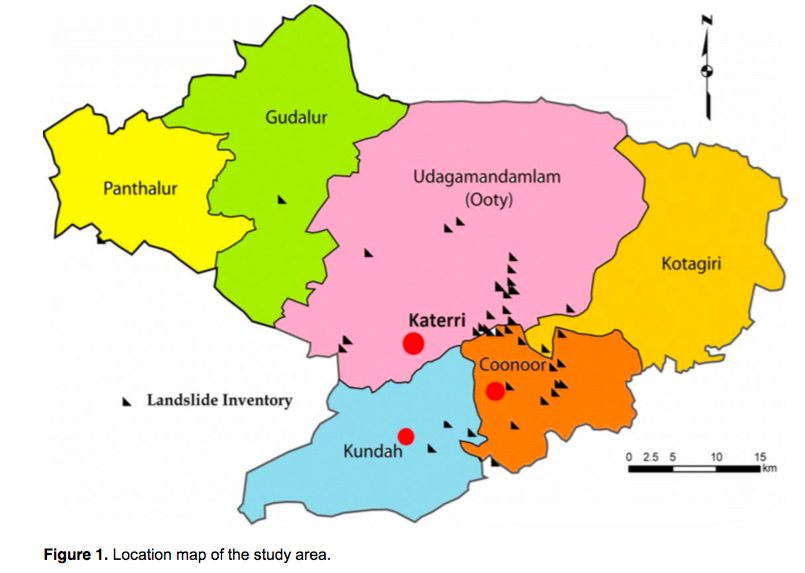
This paper is focused on water bearing zone and weathered zone in the landslide prone zone in Ooty landslide zone, Tamilnadu, India. The study area is situated near Ooty down, Amanda, India. Five profiles were carried out in the study area. The Ooty is formed in the high range of Western Ghats are known to be susceptible to landslides. This disaster cause was affected in damage to life and properties of Ooty living people. The Nilgiri Plateau is falling down stream such as bhavani, Moyar, Katteri, Connor, Kundah, and Billithada halla. The major landslides had happened in the stream path. The geologically formation of study area consist of Archean metamorphic rocks which include charnockite, biotite gneiss, laterite, and lithomorgic clay. The tectonic activity had occurred in the Precambrian period. The Predominant lineaments identified are ENE parallel to the river. It is to investigate landslides prone area of Nilgiris hills which caused damage to people and properties and to devise preventive and precautionary steps to be taken in the event future landslides. The study is to identity;
i) The slope stability by geophysical methods, ii) To identity the bed rock and weathered zone, iii) To study the ground water movement,
iv) To study the topographic conditions.
The Nilgiri hills; standing aloft from the uplands of Coimbatore, descending steeply into the Mysore Plateau towards North and merging gradually with Western Ghats in the North-West, West and South-West. The district usually receives rain from both South-West Monsoon and North-East Monsoon with average annual rainfall in the district of approximately 1695 mm (Figure 1).
Geology of the study area
The Nilgiri comprises of Archaean metamorphic rocks which include Charnockite, biotite gneiss, quartzite, hornblende granite, and dolerite. Charnockite forms the bulk of the bed rock in the Nilgiris. Soils are derived material from rocks containing moisture of organic matter and are capable of supporting vegetation.
The composition of the soil varies widely depending upon the climate environments. In structure, a top organic zone is recognized followed by ‘solum’ which consists of genetic horizons formed by soil forming process. The soil is underlined by weathered rock. There are two different types of landforms in the Nilgiri plateau. Many of the high peaks have steep rocky escarpments with or without soil cover, around which radial drainage patterns are noted. The other prominent type of landforms has gentle mounds with thick soil development, stream meandering, and general smoothening of hills.
DATA ACQUISITION
In Seismic refraction surveys (Figure 2), a very small seismic wave is generated in the ground by a seismic source placed above the surface of the ground. This Seismic wave is refracted in subsurface and detected by sensitive geophones (receiver) deployed along the ground. By measuring the travel times of the seismic waves, the nature and depth of the surface can be computed.
2D electrical resistivity imaging (ERI) data were collected from the field automatically stored in the memory of mainframe and transferred into RES2DINV format using USB cable to PC or Laptop. The collected data were processed using the RES2Dinv software. The topographical corrections were carried out in the survey. This is the very effective technique to get more reliable information in the field and collected resistivity pseudo section. Topographic survey is carried out in the selected five landslide zones by using total station (Figures 3a, b, and c).
SEISMIC DATA INTERPRETATION
The seismic studies are either by travel time curves or hydrographs. These curves are obtained as follows. In the field, by placing detector (that is, geophone) at regular intervals, the timings required for seismic waves to travel from source to receiver are noted and plotted. Such points when joined gave hydrographs (Hack, 2000). This refraction method is useful in determining the depth of marker horizons not only near the surface but also at the depths. It should be noted in this case that the refraction method gave values that are arranged in an area whose dimensions are comparable to the depth of burial of refractor. From the seismic refraction results of Kundha and Allanchi landslides the top layer constitutes lateritic soil with high saturation of water with a depth of 4 m (Figures 4 and 5). The garnetiferous charnockite intermixing with lithomorgic clay were identified in the bed rock.
2D electrical resistivity imaging (ERI) interpretation
In this method, valuable ore bodies may be located by their anomalous electrical conductivities, that is, electrical surveys may be based on natural sources of potential and current. They involve the detection of signals induced in subsurface conducting bodies by electric and magnetic
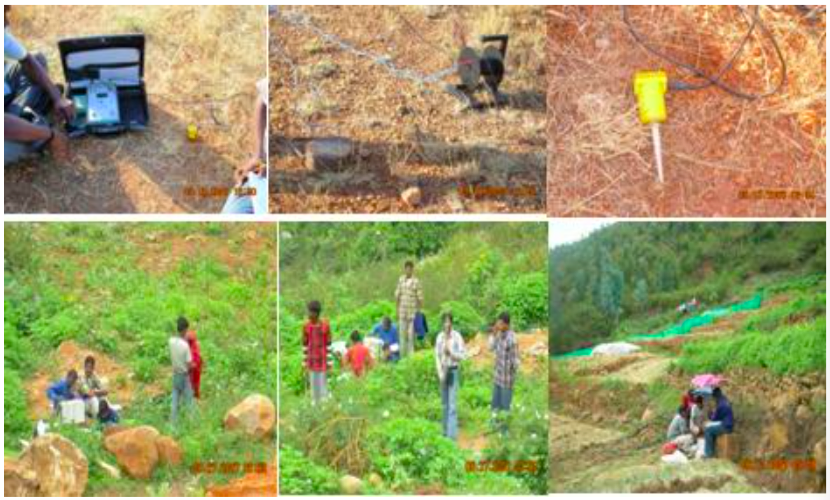
Figure 2. Seismic refraction and 2D Electrical Resistivity Imaging (ERI) data collection in the Ooty landslide area.
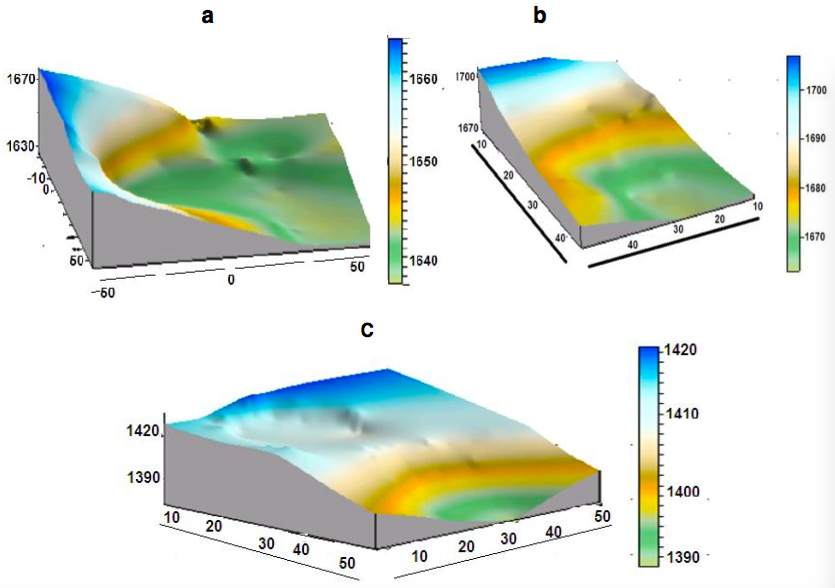
Figure 3. a, Topographical survey in Katteri Lanslide; b, Topographical survey in Allanchi Landslide; c, Topographical map of Katteri landslide (above), Allanchi landslides and Kundah landslide (bottom).
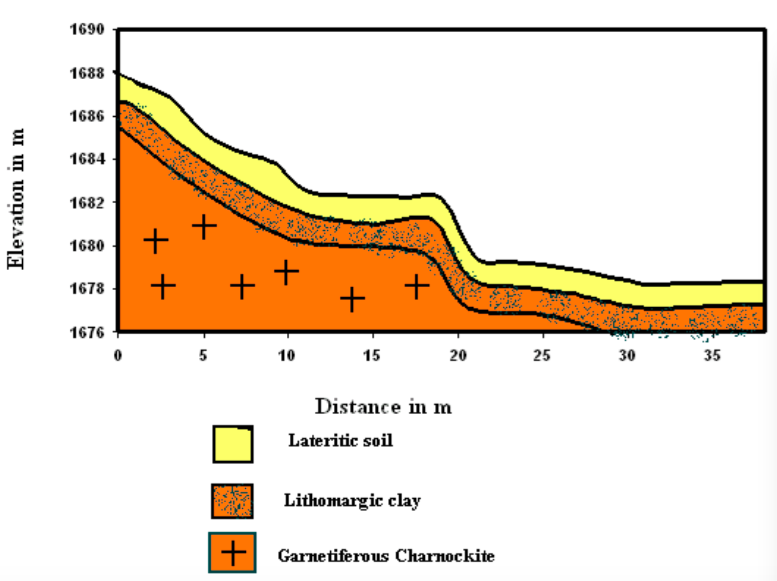
Figure 4. Shows seismic refraction and layer investigation at Kundha slide.
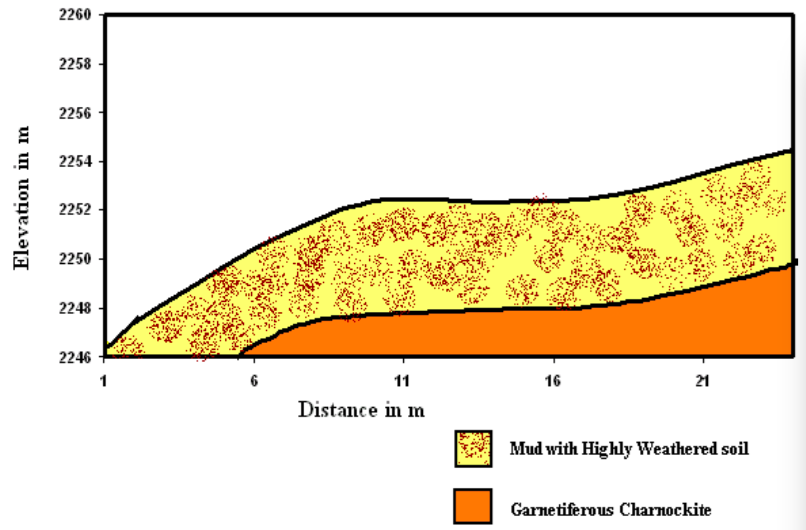
Figure 5. Interpreted seismic refraction graph and its lithomorgical section of Katteri.
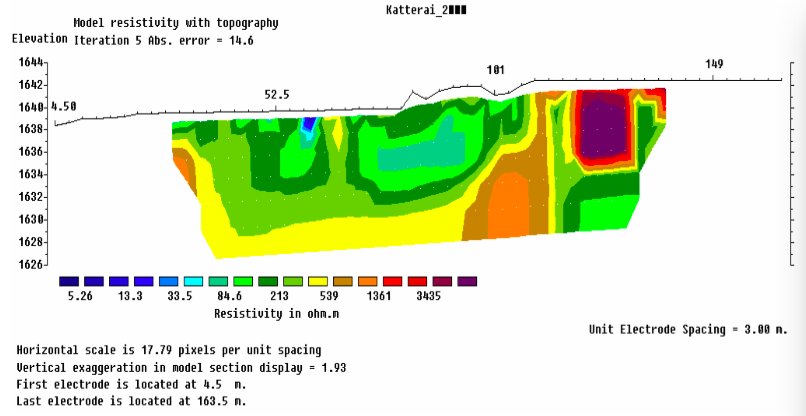
Figure 6. 2D ERI study at Katteri Landslide.
fields generated above the ground. The electrical resistivity techniques require the measurement of potential differences in the ground between suitably implanted electrodes. 2D ERI study involves measuring a series of constant separation traverse with the increase of electrode spacing with each successive traverse. The increase of electrode spacing increases the depth of penetration, so that apparent resistivity measured at various depths is used to construct a vertical contoured section, displaying the variation of resistivities both laterally and vertically over the section, (Antony Ravindran, 2010; Antony Ravindran and Ramanujam, 2012; Hack, 2000; Lines and Treitel, 1984; Rodrigues and Ayala-Carcedo, 2003; Loke and Barker, 1996). To plot the data from a 2D ERI survey, the pseudo section contouring method is normally used. In this case, the horizontal location of the point is placed at the mid-point of the set of electrodes used to make that measurement. The vertical location of the plotting point is placed at a distance that is proportional to the separation between the electrodes.
The pseudo-section plot obtained by contouring the apparent resistivity values is a convenient means to display the data. For 2D ERI studies, 40 electrodes are needed. The electrodes are alternating as current or potential electrodes. The pseudo-section is useful as a means to present the measured apparent resistivity values in a pictorial form, and as an initial guide for further quantitative interpretation (Loke, 2004).
Katteri landslides
Katteri landslide has an axis trend of NE-SW, a length of 95 m, and slope angle of 15° 52’. There are two Geoelectrical resistivity imaging survey carried out in this area. In the first profile (Figure 6), the depth of pseudo- section varies from 1620 to 1638 m .The top layer constitute lithomargic clay with resistivity ranges from 51.2 to 196 Ωm up to a depth of 12 m. The intermediate layer is weathered charnockite with resistivity ranges from 196 to 1476 Ωm. The bottom layer of the pseudo- section is compact garnetiferous charnockite with resistivity ranges from 1476 to 5664 Ωm. The pseudo- section displays the thick overlying section of lateritic soil with pockets of lithomargic clay deposits.
Kundah landslides
Kundah landslide has a trend axis of NE-SW, length of 112 m and a slope angle of 19°17'. In the profile 2 (Figure 7), the elevation variation in pseudo-section ranges from 1660 to 1688 m. The top layer constitutes lateritic soil with high saturation of water, with resistivity ranging from 0.414 to 25.2 Ωm. The bottom layer with a resistivity range of 25.2 to 99.1 Ωm, indicates the presence of Garnetiferous Charnockite. The thickness of this layer is 10 m.
Allanchi landslides
The Allanchi Landslides have an axis trend of NE-SW direction and a length of 120 m. The third profile (Figure 8) trends from NE -SW with a length of 120 m and in 4 m electrode spacing intervals. The elevation variation in pseudo-section ranges from 2262 to 2274 m. The top layer constitutes lateritic soil with resistivity ranges
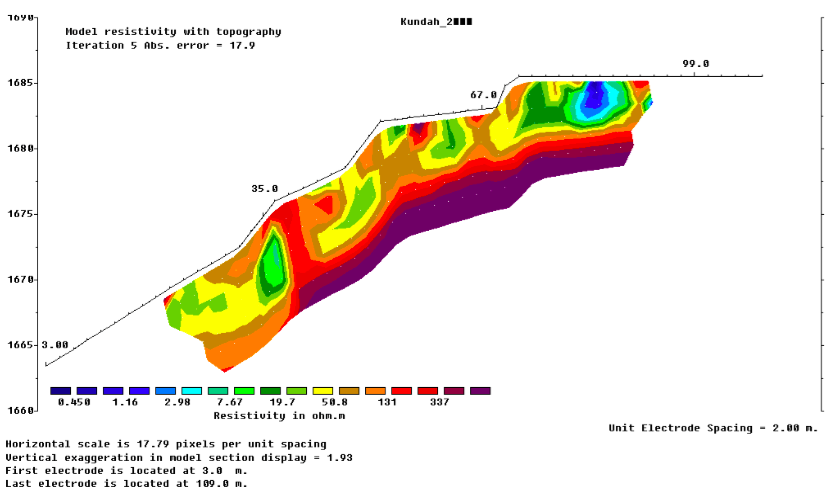
Figure 7. Delineation of landslide through Geoelectrical resistivity imaging study at Kundah.
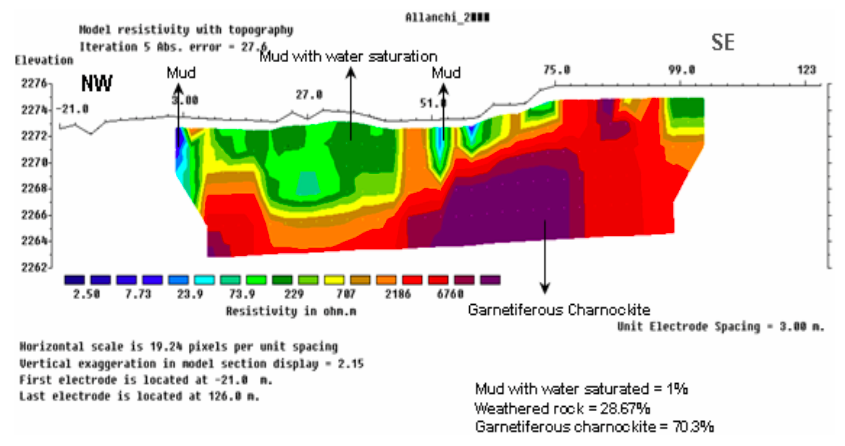
from 49.4 to 79.6 Ωm. The intermediate layer consists of Weathered zone of Charnockite bedrock rock which has a resistivity range from 128 to o 538 Ωm. The bedrock layer with resistivity ranges from 538 to 1398 Ωm, indicates the presence of Garnetiferous Charnockite.
DISCUSSION AND CONCLUSION
The fluid flow mechanism and weathered zone of Charnockite Gneiss as indicated by the low resistivity values showed the presence of a weak zone in the study area where landslides canform. The Charnockite rocks, highly jointed are filled with water and to generate Lithomargic clay .The continuous rainfall and huge amount of soil thickness in the slope are the causes for Landslides.
At the Kundha site, a zone of weathered charnockite and ground water flow is identified on the image created from the electrical resistivity survey method. During heavy rainfall, top soils (Lateritic) are highly saturated with water increasing the weight of the soil. If the moisture content increases simultaneous overburden of the material also increases. It is earthy to remove the soil from parent rock. This mechanical process and the slope of the ground surface are important factors for sliding.
The seismic refraction model of at the Allanchi site showed a top layer of mud with highly weathered soil to a depth of 4 m. The presence of clay acts as an impermeable layer with the overlying soil being saturated. Tomographic mapping showed that the elevation of the country rock is very steep and had a highly jointed zone below the clay layer. The water seepage between the bedrock and the overlying clay induced landslide.
From the above surveys in Allanchi, it is understood that there is a strong relationship between electrical resistivity and high moisture content of the soil and weathered bedrock as indicated by the inversely propor- tional low resistivity values. Another significant factor that controls the electrical resistivity of the geologic materials is the degree of saturation. A mud rock with low moisture content would behave like a hard and compact rock and have higher resistivity values, whereas, an increase in the degree of saturation results in lower electrical resistivity. The field study carried out in the Katteri, Kundah, and Allanchi sites differentiate the distribution of the resistivity values on the basis of clay soil with moisture and without moisture; and red soil/laterite with moisture and without moisture, and weathered profiles of substratum and fresh rocks. This is evident from the seismic refraction model which shows a top layer cover of mud with highly weathered soil that is 45 m wide and 4 m in thickness above bedrock consisting of Garnetiferous Charnockite. The 2D ERI study is to give a detailed image of the intermediate zone lithomorgic clay with low resistivity ranging from 5 to 50 Ωm. The basin like weathered gneiss rock formation had a range of electrical resistivity from 283 to between 50 to 100 Ωm in the study area. Seismic refraction and 2D electrical resistivity methods have been shown to be useful for identifying area of potential future landslides in the Ooty landslide prone zone.
 ENGLISH
 Chinese
 Russian

