Application of the multifractal singular value decomposition for delineating geophysical anomalies associated with molybdenum occurrences in the Luanchuan ore field (China)
Abstract:
Fractal and multifractal scaling can be found in a wide variety of geological, geochemical and geophysical applications, which provide important clues to underlying processes. In this study, the multifractal singular value decomposition (MSVD) method was used to delineate geophysical anomalies associated with Mo mineraliza- tions based on 1:25,000 scale gravity and magnetic data in the Luanchuan super-large molybdenum polymetallic ore district. The results show that: (1) negative gravity anomalies in the Luanchuan ore field have strong spatial relationships with Jurassic granite porphyry bodies associated with porphyry- and skarn-type Mo mineraliza- tions; (2) the uncertainty linked with identifying gravity and magnetic anomalies' areas is correlated with cutoffs defined in the multifractal models, which can be utilized to recognize potential Mo mineralization at depths ranging from 500 m to 2000 m; and (3) positive magnetic anomalies have weak spatial correlations with Jurassic granite porphyry bodies, but are strongly correlated with gabbro and syenite porphyries associated with Fe mineralization, and with the boundary of Jurassic granite porphyry. Compared to the 3-D Jurassic granite porphyry model and the 2.5-D gravity and magnetic inversion plots of the study area, the gravity and magnetic anomalies identified by means of the MSVD method can be integrated to identify potential Mo targets. This application demonstrates that the MSVD method is convenient, simple, rapid, and direct for delineating geophysical anomalies and for outlining potential exploration targets without processing multiple geological, geophysical, and geochemical datasets from disparate sources.
1.Introduction:
Mandelbrot's (1983) fractal geometry provides a powerful tool for describing and simulating complex forms and patterns in nature. Many geological phenomena are scale invariant, e.g., frequency-size distribu- tions of rock fragments, faults, earthquakes, volcanic eruptions, mineral deposits, and oil fields (Turcotte, 1997). Scale invariance provides a rational basis for the applicability of the fractal distribution (Cheng, 2004; Mandelbrot, 1983; Turcotte, 1997). Fractal and multifractal models are well established and have been effectively applied for describing the distributions of geological objects (Bansal et al., 2011; Carranza, 2009; Cheng, 2008; Mandelbrot, 1983; Turcotte, 1997). Fractal and multifractal distributions have been used to map geochem- ical anomalies (Carranza, 2010a,b; Cheng, 2007a; Cheng et al., 1994; Wang et al., 2012a; Zuo et al., 2009c). Many geophysical data sets, including surface gravity and magnetic data as well as topographic elevations, have power-law spectra (Turcotte, 1997). Multifractal scaling can be found in a wide variety of geological, geochemical and geophysical applications, and the applicability of multifractal statistics to study a natural phenomenon may provide important clues to its underlying physical processes (Cheng, 2008; Turcotte, 1997).
Singularity is a property of many different types of nonlinear natural processes, including cloud formation, rainfall, hurricanes, floods, land- slides, earthquakes, wildfires and mineralization (Cheng, 2008). The spatial distributions of mineral also follow power laws (Bansal et al., 2010, 2011; Carranza and Sadeghi, 2010; Carranza et al., 2009; Pilkington and Todoeschuck, 1993; Turcotte, 1997; Zuo et al., 2009a, 2009b). The main proposition supporting the use of nonlinear theory and the application of power law models is that mineralization results from singular processes that can be characterized by power law models (fractal/multifractal) (Cheng, 2007a; Zuo et al., 2009c). In the nonlinear theory, ore-forming processes represent one kind of singular geological processes that may result in an anomalous amount of energy release or material accumula- tion within a narrow spatial and temporal interval. Mineral deposits and ore-forming anomalies resulting from singular geological processes exhibit fractal/multifractal distributions, which can be described by power law functions (Cheng et al., 2009; Wang et al., 2011). Filtration and extraction from geophysical data information associated with ore- forming processes (i.e., recognizing and separating them from the whole complicated geological process) are the subject of the present study.
The multifractal singular value decomposition (MSVD) method is based on both singular value decomposition (SVD) and fractal/ multifractal theories. The SVD has been used in geophysical data processing, e.g., for compressing seismic reflection profiles (Jackson et al., 1991; Ulrych et al., 1988), radar processing (Cagnoli and Ulrych, 2001), enhancing weak signals in vertical seismic profiles (Freire and Ulrych, 1988). It has also been used in multi component seismic polarization filters (De and Musacchio, 2001; Rao and Bhimasankaram, 2000) and noise separation. SVD is also termed matrix spectrum decomposition since singular values (SVs) obtained from SVD are analogous to projection coefficients for quantifying how much energy SV-related subspaces contribute to total energy (Rao and Bhimasankaram, 2000).
he matrix spectrum decomposition plays a similar role to that of the power spectrum in the frequency domain (Li and Cheng, 2004). The latter method has significantly increased the usefulness of fractal/multifractal theories and methods (Bansal et al., 2011; Cheng, 2007b; Li, 2005; Maus and Dimri, 1994, 1996; Pilkington and Todoeschuck, 1993; Turcotte, 1997).
This paper aims to (1) analyze scattered geophysical data in 2-D gravity and magnetic data surveyed at a scale of 1:25,000 in the Luanchuan ore field (China) using the MSVD method, (2) investigate the spatial relationship between deep geological bodies/structures and Mo mineralization in the ore field by deriving gravity and magnetic anomaly information at a particular frequency, and (3) provide valuable evidence for mapping targets for Mo mineralization. These results were compared with those of the 2.5-D and 3-D gravity and magnetic inversions (Wang et al., 2012b).
2. Methodology
The SVD is a useful tool in the field of numerical linear algebra (Alter et al., 2000; Lewis et al., 1999; Li and Cheng, 2004; Schertze and Lovejoy, 1991). A matrix A(m,n) can be decomposed into a series of eigen images. The eigenvalues represent a fractal/multifractal distribution described by a power law function (Cheng, 2005; Cheng et al., 2009; Li and Cheng, 2004; Zhao and Chen, 2011). It is a factorization of a rectangular matrix A(m,n) into orthogonal matrices, which can be decomposed into products of eigenvalues (λi) and eigenvectors:

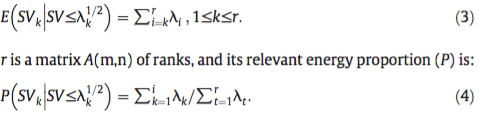
where r is the rank; σi is the i-th SV or weight with σ1 ≥σ2 ≥⋯≥σr ≥0; ui and vi are the left and right eigenvectors, respectively; uiviT is an A(m,n) matrix of unitary rank, called the i-th eigen image of A(m,n). The σi and eigenvalues (λi) can be written as follows:

Eq. (2) corresponds to the spectral energy densities of eigen images (Cheng, 2007b; Li, 2005). Therefore, the total energy (i.e., a measurement of the energy within a spectral energy radius or scale)
squared SVs are larger than λi and can be written as (Li and Cheng, 2004):
Based on Eqs. (3) and (4), an energy within the radius of the corresponding energy can also be expressed as an energy spectrum for certain scales. To rank for format as italics matrices, the different energy measures have a sequence of scale variation corresponding with the energy spectrums. If the energy measure represents anisotropic scale invariance, it can be described by a multistage power law distribution (Li and Cheng; 2004; Mandelbrot, 1983; Turcotte, 1997). Eqs. (3) and (4) can be then expressed, respectively, as (i.e., they can be one segment or multiple segments (fractal or multifractal) in a log–log plot):
where E(SVk) is the k-th SVk spectral-energy density of A(m,n). Usually in different scales, Eq. (6) will have different exponents or the bi-logarithm coordinates of corresponding to multiple slopes are defined by different line segments (Li and Cheng, 2004). Therefore, Eq. (6) can be utilized for defining cutoffs to separate eigenvalues into groups, and then each of the groups can be combined to form decomposed components of the gravity or magnetic map.
In this study, the MSVD method was implemented using GeoDas software (Cheng, 2000) and the resulting maps were integrated and analyzed using Matlab and ArcGIS softwares. The outer SVD map of the left and right eigenvectors forms an orthogonal self-contained base. The selection of SVs and their corresponding subspaces was therefore an important issue in the present SVD study.
The SVD–MSVD method involves plotting a graph of energy/ spectrum density versus energy/spectrum radius (or spectrum scale) (Lewis et al., 1999; Li and Cheng, 2004) on a log–log coordinate system (i.e., the MSVD plot). Straight-line segments indicating clusters of energy in the subspace are fitted to the plot using the least-squares method. The 2-D MSVD map reconstructed from such clusters of energy often contains significant textures or structures reflecting specific geological, geochemical, geophysical or ore-forming processes. The MSVD method does not need to estimate the power spectrum. Therefore, there are no map edge effects caused by the power spectrum estimation (Cheng, 2000).
Based on the multifractal energy structure, the MSVD method is proposed here for the selection of SVs to separate anomalies from background in a geophysical map, and for texture or structure reconstruction (or extraction) to map mineral potential. The MSVD has a number of advantages for handling exploratory datasets, and it is more sensitive to linear texture or structure than other methods of SVD (Cheng, 2007b).
3. Case study
3.1. Geological setting of the Luanchuan ore field
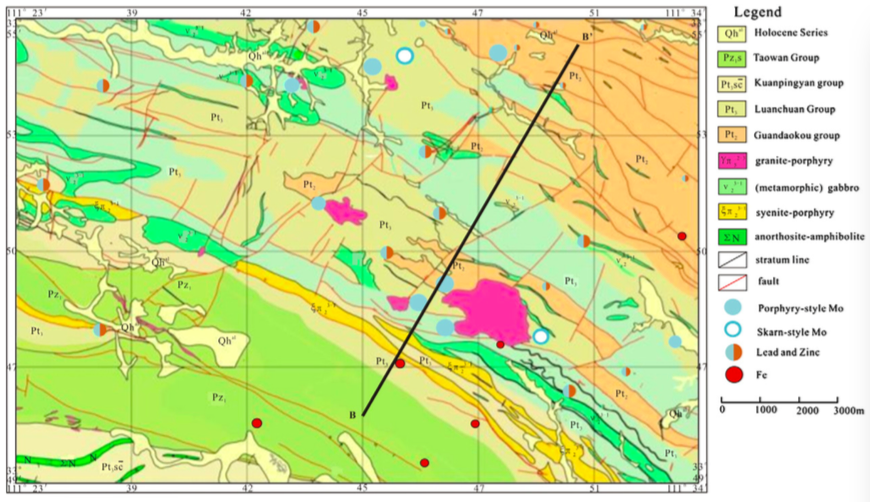
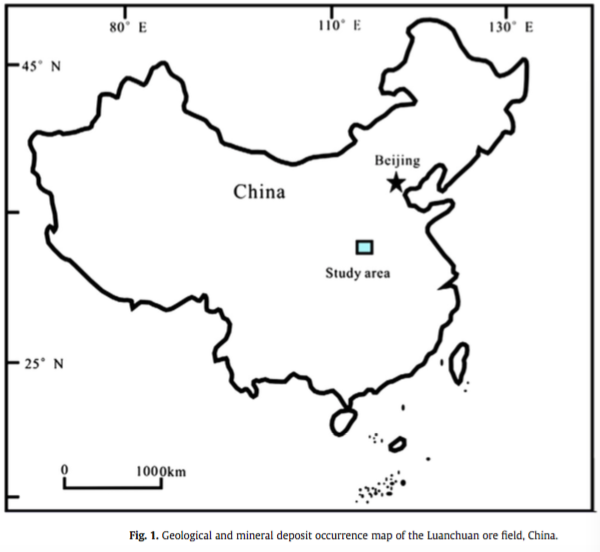
Luanchuan is located in southwestern Henan province (China) and it is an important Mo and Pb–Zn–Ag polymetallic district covering about 210 km2 (Fig. 1). The area is tectonically situated in the eastern part of the Nannihu Mo polymetallic metallogenic belt along the southern margin of the North China Craton (Mao et al., 2009; Wang et al., 2011, 2012b; Yan and Liu, 2004; Ye et al., 2006). The Late Proterozoic syenite, metamorphic gabbro, and Jurassic granite porphyry are associated with mineral deposits where NW and NE trending faults have developed, and acted as foci of ore-forming polymetallic metallogenesis, favoring large and super-large Mo deposit formation.
Regional fault structures and fold structures are well-developed in the study area. The main NW trending faults are important metallogenic fluid pathways (Mao et al., 2009). Fold structures are complex as the anticline is generally intact but intruded by Jurassic granite porphyry that is associated with Mo mineralization, whereas the syncline is generally cut by NW-trending fault that is associated with Pb–Zn mineralization. Fold structures in the center of the study area had been identified as mainly belonging to the Huangbeiling anticline and comprising Luanchuan and Guandaokou Groups (Wang et al., 2011, 2012b).
The primarily plutonic rocks are Late Proterozoic syenite, meta- morphic gabbro, and Jurassic granite porphyry. The latter consists of massive and extensive granite bedrock and granite porphyry; the granite porphyry has been related to mineral resources in the study area. There are 10 Mo deposits (eight porphyry-type Mo deposits and two large skarn-type Mo deposits), and more than 11 Pb–Zn deposits/ occurrences in the study area. Re–Os isotopic dating has placed large- scale Mo and Pb–Zn mineralization at about 140 Ma (Ye et al., 2006). Most of hydrothermal vein-type Pb–Zn deposits/occurrences in the study area have similar spatio-temporal metallogenesis as the porphyry-type Mo deposits (Mao et al., 2009; Wang et al., 2011), where hydrothermal solutions leached metals from the carbonate host rocks and precipitated them in available structures such as extension sites along faults and discordant strata boundaries. On the basis of the above-described geological setting and information regarding known deposits/occurrences in the study area, we have defined a conceptual geological and metallogenic model for the Luanchuan ore field as follows. The Pb–Zn deposits or occurrences have been transformed by Jurassic tectonic–magmatic activity. The skarn-type Mo and hydrothermal vein-type Pb–Zn deposits are found mostly around porphyry-type Mo deposits, and Pb–Zn mineralization occurs in layered skarn or inter-layered fracture zones. The Pb–Zn mineral deposits or occurrences were controlled by the Middle-to-Late Proterozoic marble strata of the Luanchuan Group, which include the Nannihu, Meiyaogou and Sanchuan Formations. Most Pb–Zn occurrences are located in inter-layered fracture zones in the Luanchuan Group, and their attitudes are generally associated with regional NW-trending faults and folding zones. Therefore, a detailed characterization of the morphology of the concealed granite porphyry as well as that of the metallogenic host strata (i.e., the Nannihu, Meiyaogou, and Sanchuan Formations of Luanchuan Group) was considered important for effective analysis and prediction of potential Mo targets in the study area.
3.2. Identifying gravity and magnetic anomalies
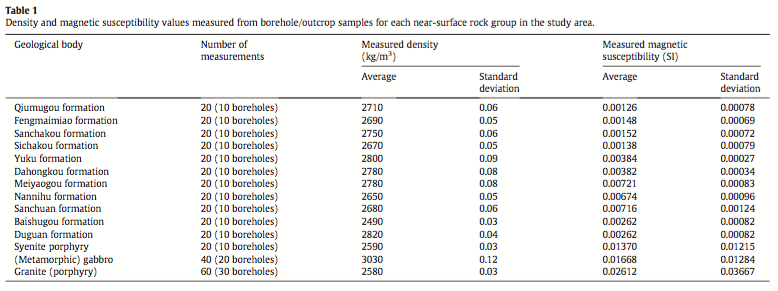
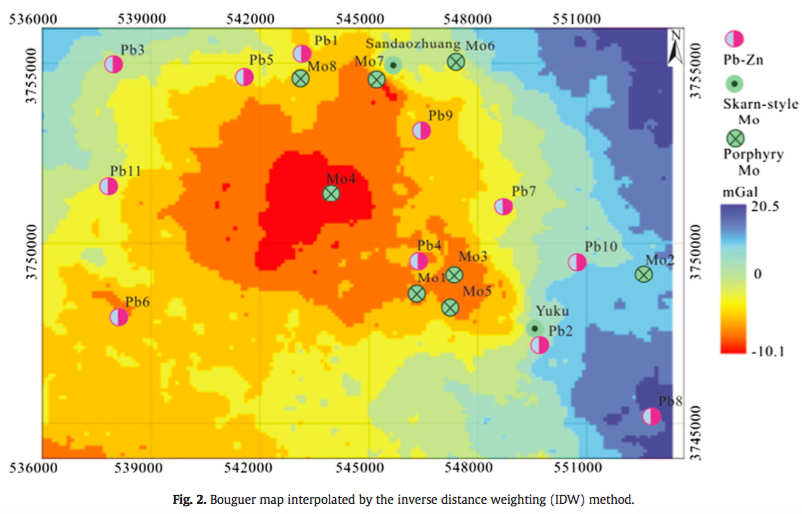
The LaCoste and Romberg type D gravity meter (100#) were used on a 20 points/km2 grid to measure and map gravity over the study area (i.e., 4211 measurement points in total). Table 1 lists the physical property measurements. After ignoring poor data, 4095 effective gravity measurement points were used for the derived Bouguer gravity anomaly contour map, on a 100 m × 100 m grid size and 0.5 mGal interval (Fig. 2).
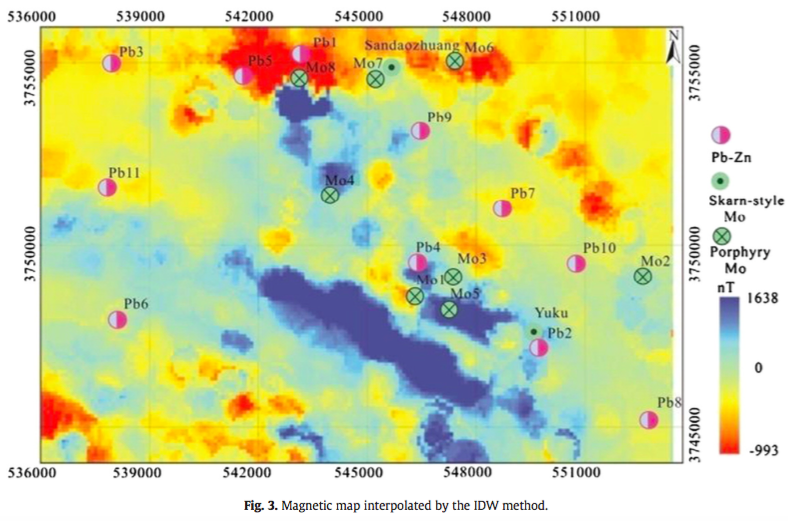
A high-precision magnetic survey was carried out using a WCZ-1 proton magnetometer with ± 0.1 nT resolution and a reading accuracy of ± 0.5 nT. The magnetic anomaly contour map of the study area (Fig. 3) has a 100 m × 100 m grid size and contour interval of 50 nT based on data from 4071 effective measurement points. The magnetic declination is 3° West in the study area.
In the study area, intrusive rocks are generally linked with high magnetic features, and the Jurassic granite porphyry units are associated with lower gravity and higher magnetic features. These geophysical features are the basis for identifying porphyry-type Mo prospective zones and to infer skarn-type Mo prospective zones into the study area using gravity and magnetic anomalies (Figs. 2 and 3). Skarn-type Mo prospective zones are associated with porphyry-type Mo prospective zones in the Nannihu ore region (see Mo7 deposit in Figs. 2 and 3).
The main proposition supporting the application of the non-linear theory and power law models in the present case is that since mineralizations may be regarded as products of a singular geological process, they could be characterized by power law models (Cheng, 2007a, 2008). Considering the broad geophysical anomalies associat- ed with the Jurassic granite porphyry and porphyry-type Mo deposits in the study area (Figs. 2 and 3), further analysis was required to reduce the anomalous areas to more well-defined features that are directly related to mineralization and locations of mineral deposits.
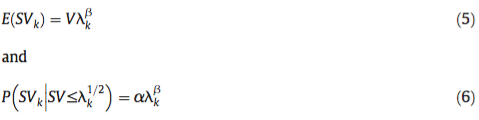
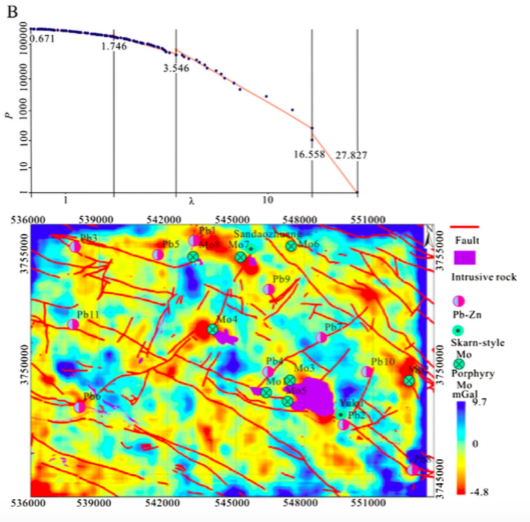
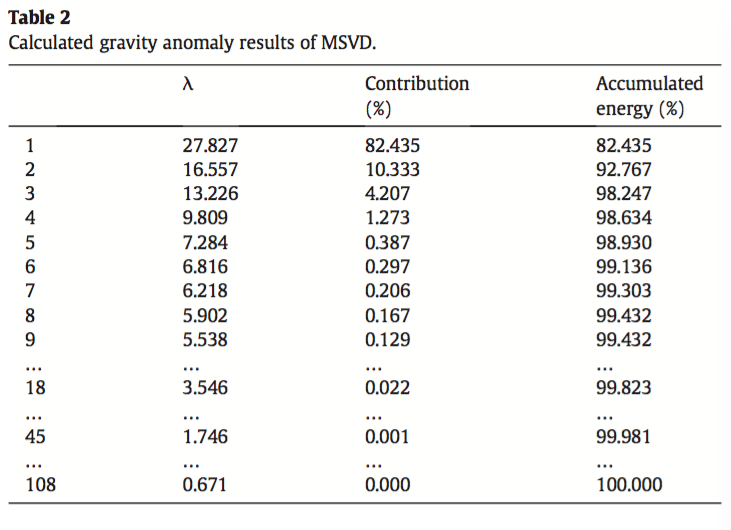
On basis of the above proposition, Eq. (6) represents a power law distribution such that MSVD plots of λ−P can be modeled by line segments having different slopes. The log–log plots of λ − P for the gravity data in the study area can be modeled by four segments defined by cutoff points between straight line segments with different slopes fitted by least-squares method (Fig. 4), and the cutoff points are λ1, λ4, λ18, λ45, and λ108 (Table 2, Fig. 4A). The most segment of the plots in Fig. 4A represents λ1, λ2, λ3 and λ4, and the percentage of their accumulated energy is 98.63%. The most segment
of the plots in Fig. 4B represents λ1, λ2 and λ3, and the percentage of their accumulated energy is 98.25% (Table 2). Comparing Fig. 4A with Fig. 4B, we can see that gravity anomalies have similar spatial distributions in the region proximal to porphyry- and skarn-type Mo deposits but not in the regions distal to these deposits. Therefore, definitions of gravity anomaly zones have uncertainty due to the multiple fractal cutoffs.
In this paper, we utilized geological information (e.g., from field survey, geological map, and borehole data) to further identify which cutoff between λ3 and λ4 eigen images is objective. Based on the distribution of the Jurassic granite porphyry units at the surface of the Luanchuan ore field, the sum of the λ1, λ2, and λ3 (1st, 2nd, and 3rd, respectively) eigen images (Fig. 4B) generally reflects local granite porphyries associated with porphyry- and skarn-type Mo mineraliza- tions in the study area. The contribution rankings from the 4th to 18th eigen images, with a cumulative energy of 1.57% (Table 2), are less than for the 3rd eigen image. The energy from the 4th to 18th eigen images has uncertainty and may reflect either minor ore-controlling factors or noise from various errors.
Fig. 4B shows that the Jurassic granite porphyry units and porphyry- type Mo deposits are distributed around low gravity anomalies. These gravity anomalies likely represent tectonic extensional zones into which the Jurassic granite porphyry intruded, and are thus the regional ore- controlling factor for the porphyry- and skarn-type Mo mineralizations in the study area. Fig. 4B also shows the configurations of the Jurassic granite porphyry units (with negative gravity anomaly values varying between −4.81 and −1.21 mGal) and the ring contact zones (with low positive gravity anomaly varying from 0.10 to 0.82 mGal) around the Jurassic granite porphyry units. The porphyry and skarn-type Mo deposits occur within and around the Jurassic granite porphyry units whereas the hydrothermal vein-type and Pb–Zn vein-type deposits occur along the contact zones of the Jurassic granite porphyry units.
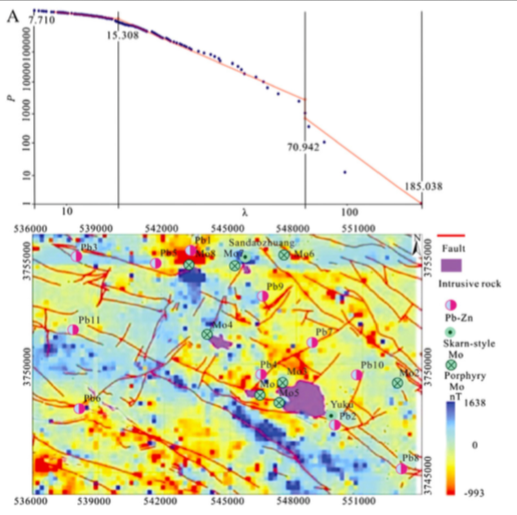
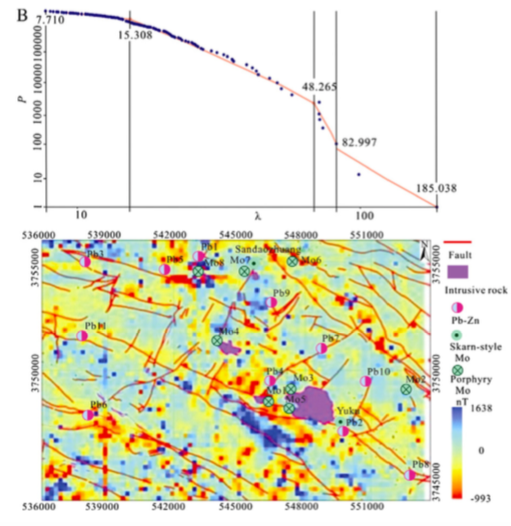
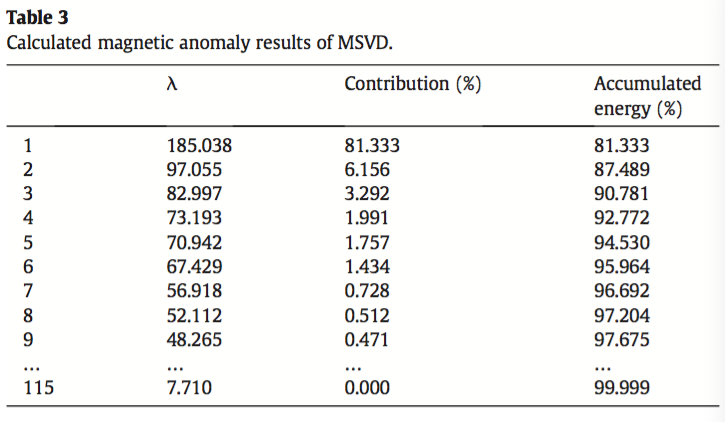
Similar procedures for implementing the MSVD method were applied to the magnetic data (Figs. 3 and 5). The plots of λ − P for the magnetic data in the study area can be modeled by three to four segments defined by cutoff points between straight lines with different slopes (Fig. 5A), and the cutoff points are λ1, λ5, λ62 and λ115 (Table 3). The most segment comprising λ1, λ2, λ3, λ4 and λ5 with accumulated energy of 94.53% of the accumulated energy (Table 3). In order to accurately identify potential target zones of mineralization associated with the Jurassic granite porphyry in the Luanchuan ore field, the reconstructed magnetic anomaly map with the sum of the λ1, λ2, and λ3 eigenimages (Fig. 5B) generally reflects local ore- controlling factors and represents 90.78% of the accumulated energy (Table 3). The results show that the zones with known porphyry- and skarn-type Mo deposits are associated with positive magnetic anomalies in the Jurassic granite porphyry units and strata of the Luanchuan Group, with values varying from 128.68 to 826.13 nT. Zones with higher magnetic anomalies (> 850 nT) are associated with iron deposits in the Late Proterozoic syenite, metamorphic gabbro bodies, or hosted in the Taowan Group strata (Fig. 1).
Using the geological map of the study area as a basis, MSVD reconstructed negative gravity anomalies are mostly associated with granite porphyry intrusive bodies associated with porphyry- and skarn- type Mo deposits, MSVD reconstructed high magnetic anomalies (with > 10 nT) are mostly associated with NW trending faults associated with hydrothermal vein-type Fe, Mo and Pb–Zn mineralizations. MSVD reconstructed low gravity (b0 mGal) and high magnetic anomalies can be integrated to identify potential porphyry- and skarn-type Mo targets associated with Jurassic granite porphyry bodies in the study area.
4. Discussion and conclusions
To check the efficiency of the MSVD method for delineating geophysical anomalies associated with porphyry- and skarn-type Mo occurrences in the Luanchuan ore field, three other methods were used to delineate gravity and magnetic anomalies associated with
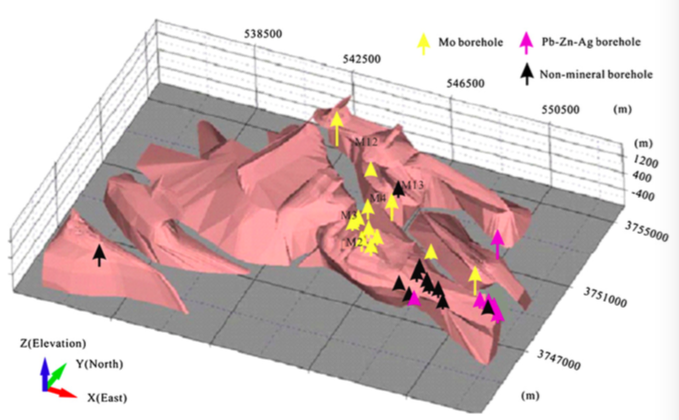
Fig. 6. 3-D granite porphyry intrusive rocks and borehole model (vertical depth = 2500 m). Yellow boreholes indicate porphyry-type Mo samples; purple boreholes indicate skarn- type Mo samples; black boreholes indicate no Mo mineralization or granite samples. The latter do not necessarily indicate a lack of Mo mineralization at depth, since the borehole depth is limited.
ranite porphyry units or porphyry- and skarn-type mineralization targets.
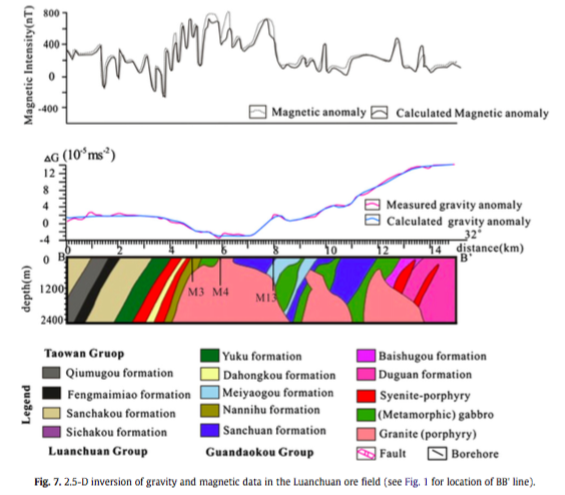
Firstly, Fig. 6 is a 3-D granite porphyry and borehole model that was constructed using multiple-scale geological maps, 2.5-D gravity and magnetic data inversion, and data from boreholes at depths varying from 800 m to 1200 m (Fig. 7) (Wang et al., 2011, 2012b). The 3-D model allows delineation of granite porphyry bodies at the surface and concealed granite porphyry bodies at depth in the study area, and these granite porphyry bodies are key mineral exploration indicators for potential porphyry- and skarn-type Mo targets in the
study area. The borehole data show that the porphyry- and skarn- type Mo deposits are associated with granite porphyry bodies belonging to a single batholith. Compared to the gravity and magnetic inversions, the results of MSVD analysis can be utilized to identify surface/subsurface granite porphyry bodies in the study area, and, considering uncertainty of interpretation of the vertical extent, the effective identified depths of the granite porphyry bodies range from 500mto2000m.
Secondly, Table 4 and Figs. 4B and 5B show that all of the known porphyry- and skarn-type Mo deposits are linked with negative gravity
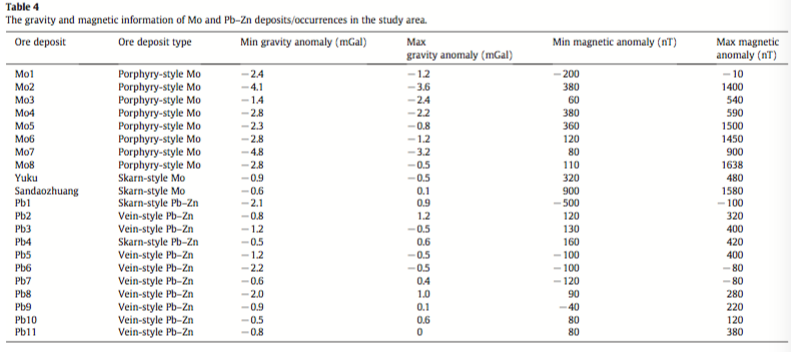
anomalies and positive magnetic anomalies, whereas many of the known Pb–Zn occurrences/deposits are also associated with similar geophysical features because these different deposit types belong to the same magma-hydrothermal metallogenic system/model in study area.
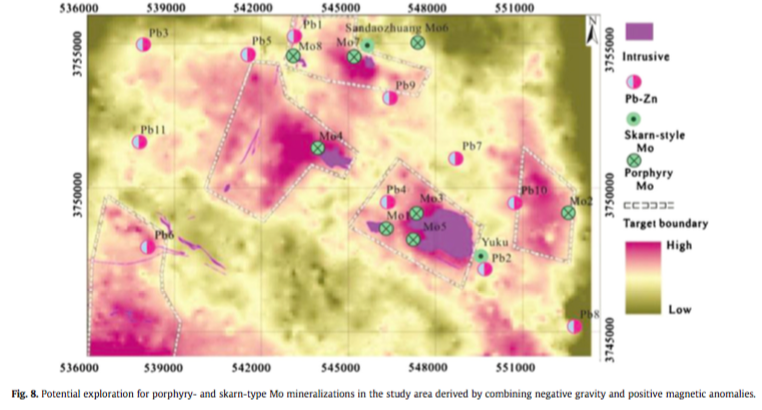
Thirdly, visible image fusion method was utilized to identify potential porphyry- and skarn-type Mo targets in the study area. On basis of negative gravity and positive magnetic anomalies in Figs. 4B and 5B, respectively, with additional constraints from granite porphyry bodies at the surface, NW and NE trending faults, fold structure, Luanchuan Group, and the known Mo and Pb–Zn deposits, five potential target areas for porphyry- and skarn-type Mo deposits were produced (Fig. 8) using visible image fusion method with Matlab software. The features of these target areas are as follows: (i) the Yuku target area has the largest intrusive granite porphyry body in the study area, which is associated with the Yuku skarn-type Mo deposit, Mo3 and Mo5 porphyry-type Mo deposits and Pb2 and Pb4 Pb–Zn deposits (Fig. 8), with the porphyry-type Mo deposits being related to concealed granite porphyry at depth; (ii) the Sandaozhuang target area has skarn-type Mo deposit associated with the Nannihu granite porphyry body (Mo7 in Fig. 2), Mo7, Mo4, Mo1, and Mo8 porphyry-type Mo deposit area located in different parts of this granite porphyry; (iii) Mo2 target area has a concealed granite porphyry body at depth based on borehole data, and the Pb10 Pb–Zn deposit is related to the western boundary of this concealed granite porphyry body; (iv) Mo4 target area has the Huangbeiling granite porphyry body, which is situated near the Huangbeiling anticlinal core of the study area and it is regarded as the center of the Luanchuan batholith of granite porphyry; and (v) Taowan target area has Pb6 Pb–Zn deposit in the lower left of the study area where NW trending dikes of granite porphyry crop out and a granite porphyry body is concealed at depth.
In the study area, positive gravity anomalies are generally characteristics of the Middle Proterozoic strata. Although negative gravity anomalies apparently reflect the Jurassic granite porphyry, some of those anomalies have multiple interpretations or uncertainty (e.g., negative gravity anomalies of −0.1 to −1.0 mGal are associated with some Pb–Zn occurrences/deposits or with some intersections of fault structures). The NW-trending positive magnetic zones represent regional ore-controlling faults, whereas negative magnetic zones generally represent strata of the Kuanping, Taowanand Guandaokou
Groups that are not associated with Mo and Pb–Zn deposits/ occurrences (Figs. 3 and 5B). To avoid uncertain interpretations, Mo ore-forming factors (e.g., granite porphyry units, NW and NE trending faults) and ore-controlling factors (e.g., fold structure and Luanchuan Group) can be combined to recognize and interpret potential targets for porphyry- and skarn-type Mo deposits.
Compared to the 3-D geological model, the 2.5-D inversion model of gravity, and the statistical analysis of polymetallic deposits in the Luanchuan ore field, this paper has demonstrated that the MSVD method is useful for quick, accurate and effective delineation of geophysical anomalies associated with Mo occurrences in a complex geological setting with complex metallogenesis. By combining the results of MSVD analysis with knowledge of the geological setting of the Luanchuan ore field, it is possible to determine local ore-controlling factors and exploration signs in the area using 1:25,000 scale gravity and magnetic datasets. The method also can be used in other polymetallic districts in the world.
 ENGLISH
 Chinese
 Russian

