Contrast Report of Instrument Properties
between WTEM-1Q and GDP-32 TEM Systems
I. Test Condition Explanations
1. GDP-32 TEM System Composition
-
A GDP-32 Measuring Host
-
A NT-20 Transmitter
-
A 30AH Battery
2. WTEM-1Q System Composition
-
A WTEM-1Q Transmitting-Receiving Integration Host
-
A PDA
-
A 30AH Battery
3. Other Conditions
-
The two systems use the same transmit coil and its damping resistance, the same receiving coil and its damping resistance and the same connecting line between the coil and the instrument when contrasting.
-
The two systems use the same emission current and the similar sampling time windows (There is no measurement effects comparison of the two systems when they work in the shallow time windows because the Nano Channel of GDP-32 system which participates in this comparison can’t work normally, and the two systems all use the middle-deep time windows samples when contrasting practically).
-
The emission current is 0.5A in the lab contrast and it is 1A in the field contrast.
4. Transmit Coil Size: 1.5m×1.5m 24 turns
5. Receiving Coil Size: 0.5m×0.5m 80 turns
6. Measuring Device: Central Loop
7. Stacking Fold: 32
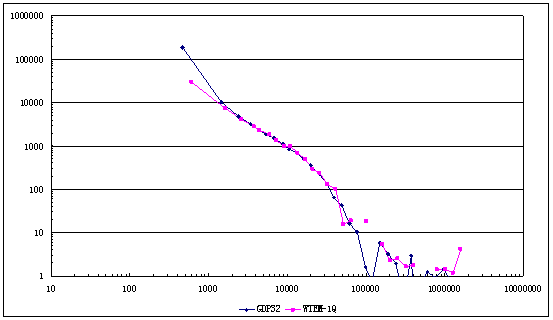
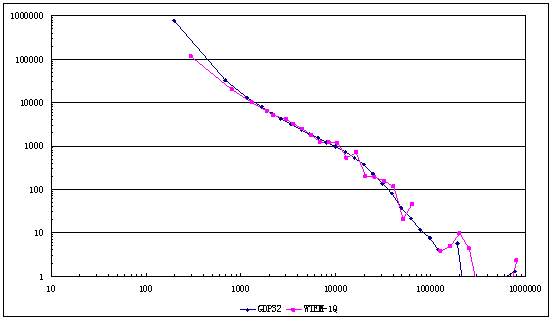
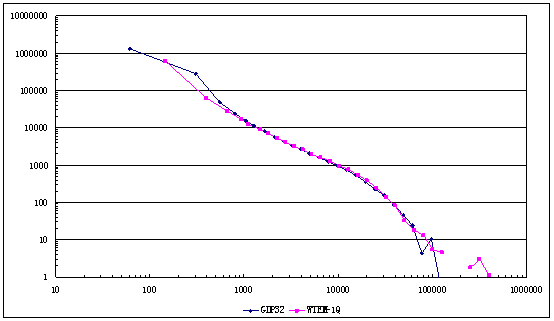
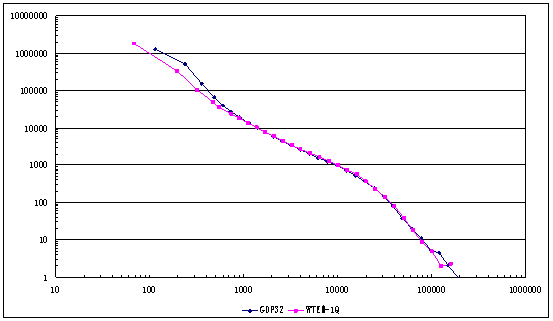
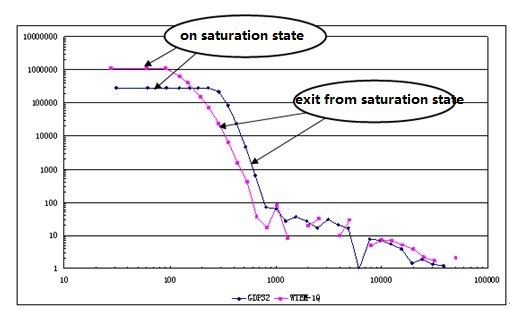
8. In the chart, the axis of ordinate means normalized voltage value in μV/A and the axis of abscissa means time in μs.
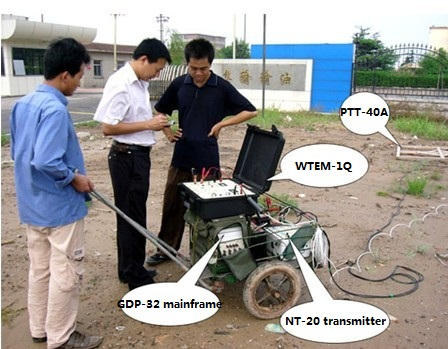
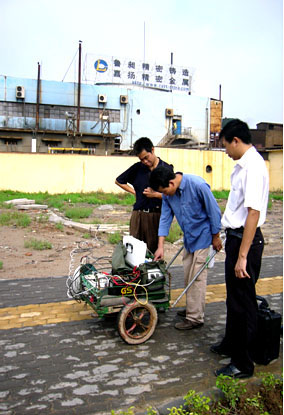
The Data Acquisition Field for Instruments Contrast(1)
The Data Acquisition Field of Instrument Contrast(2)
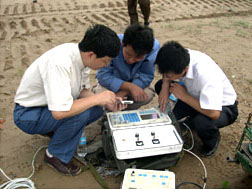
The Data Acquisition Field of Instrument Contrast(3)
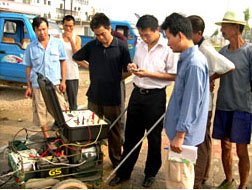
The Data Acquisition Field of Instrument Contrast(4)
II. The Results of Lab Test
Chart1 1/16 Hz Measurement Results Contrast
Chart2 1/8 Hz Measurement Results Contrast
Chart3 1/4 Hz Measurement Results Contrast
Chart4 1/2 Hz Measurement Results Contrast
Chart5 1 Hz Measurement Results Contrast
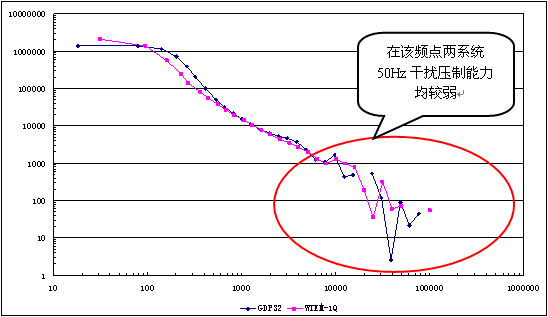
Chart6 2 Hz Measurement Results Contrast
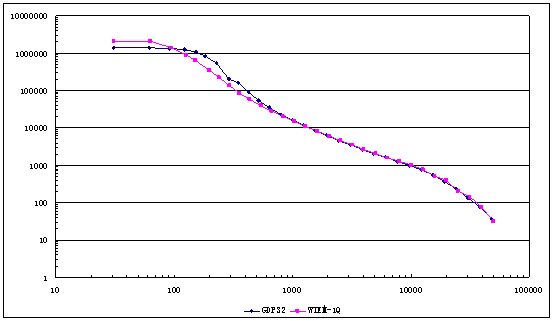
Chart7 4 Hz Measurement Results Contrast
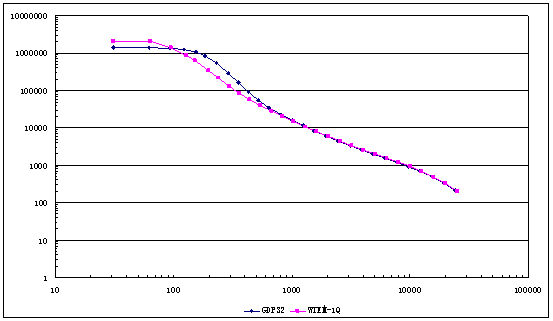
Chart8 8 Hz Measurement Results Contrast
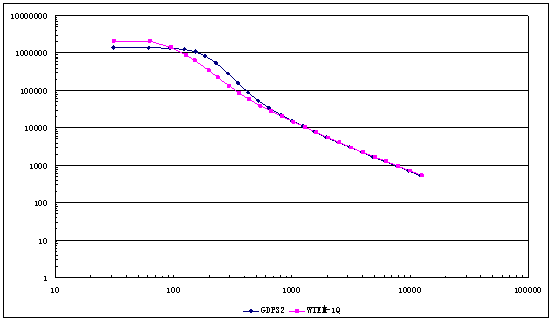
Chart9 16 Hz Measurement Results Contrast
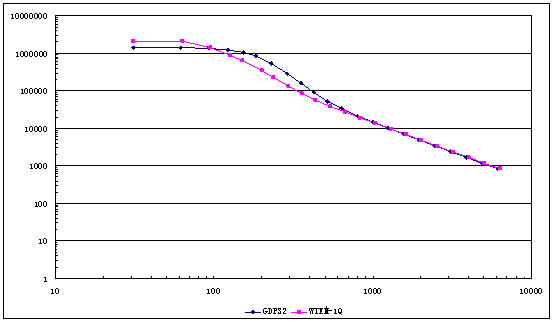
Chart10 32 Hz Measurement Results ContrastVI. The Contrast Test Conclusion
Chart17 Stake Number 600 4 Hz Measurement Results Contrast
III. The Results of Field Strong-Interference-Segment Test
Chart11 Stake Number 400 4 Hz Measurement Results Contrast
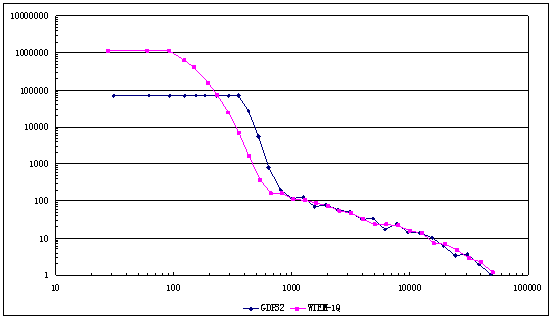
Chart12 Stake Number 422 4 Hz Measurement Results Contrast
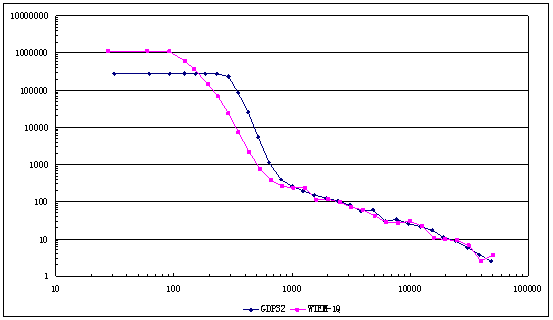
Chart13 Stake Number 450 4 Hz Measurement Results Contrast
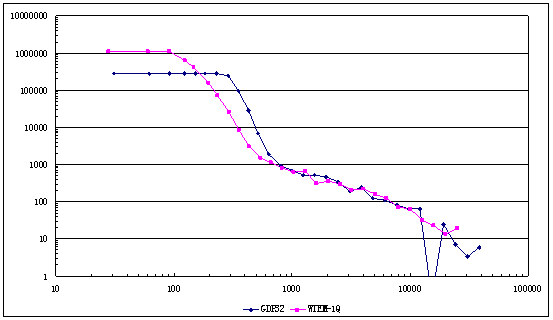
Chart14 Stake Number 475 4 Hz Measurement Results Contrast
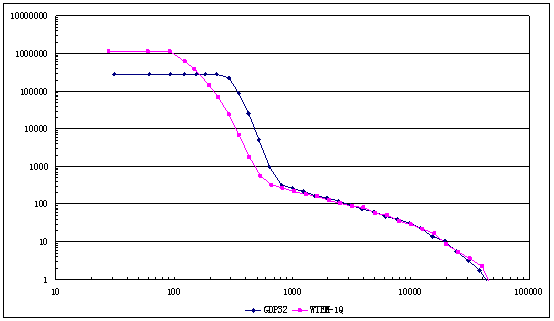
Chart15 Stake Number 500 4 Hz Measurement Results Contrast
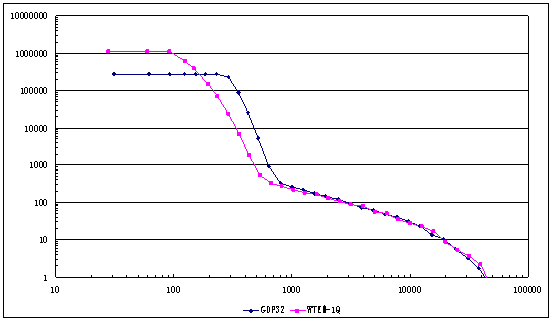
Chart16 Stake Number 575 4 Hz Measurement Results Contrast
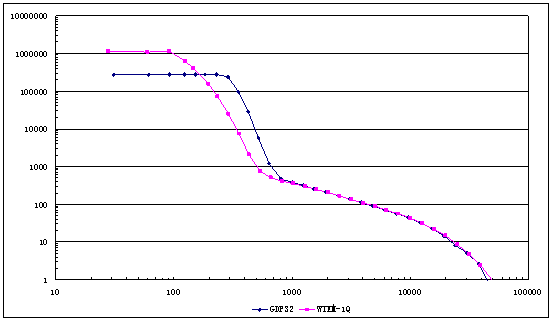
Chart17 Stake Number 600 4 Hz Measurement Results Contrast
VI. The Contrast Test Conclusion
-
In terms of portability and maneuverability, obviously WTEM-1Q system is better.
-
WTEM-1Q system indicates the decay curve directly in the measurement process , therefore, it is clearly that the repeatability is good or bad, while GDP-32 system could only monitor some time window value and indicate the decay curve when the measurement ends.
-
From Chart1 to Chart3, we can see the noise reaction of GDP-32 system is lower than that of WTEM-1Q system slightly in the late signal part of the low frequency point.
-
We can see the two systems’ interference-neutralization capabilities against 50Hz power frequency at 2Hz frequency point are both weak from chart6, which is due to the systems’ inefficient interference-neutralization capabilities against 50Hz power frequency with the designed principles when 2Hz frequency point works.
-
From chart11 to chart17, we can see that the neutralization capability against interference of the two systems are at the same level.
-
From chart5 to chart7, we can see the measuring channel reaction and the leaving saturation speed of WTEM-1Q system are both faster than those of GDP-32 system, and WTEM-1Q system’s ability to reflect the early signals is much stronger than that of GDP-32 system.
 ENGLISH
 Chinese
 Russian

