Detect the Deep Crystalline Rock Aquifers using 1D VES Technique in India
ABSTRACT
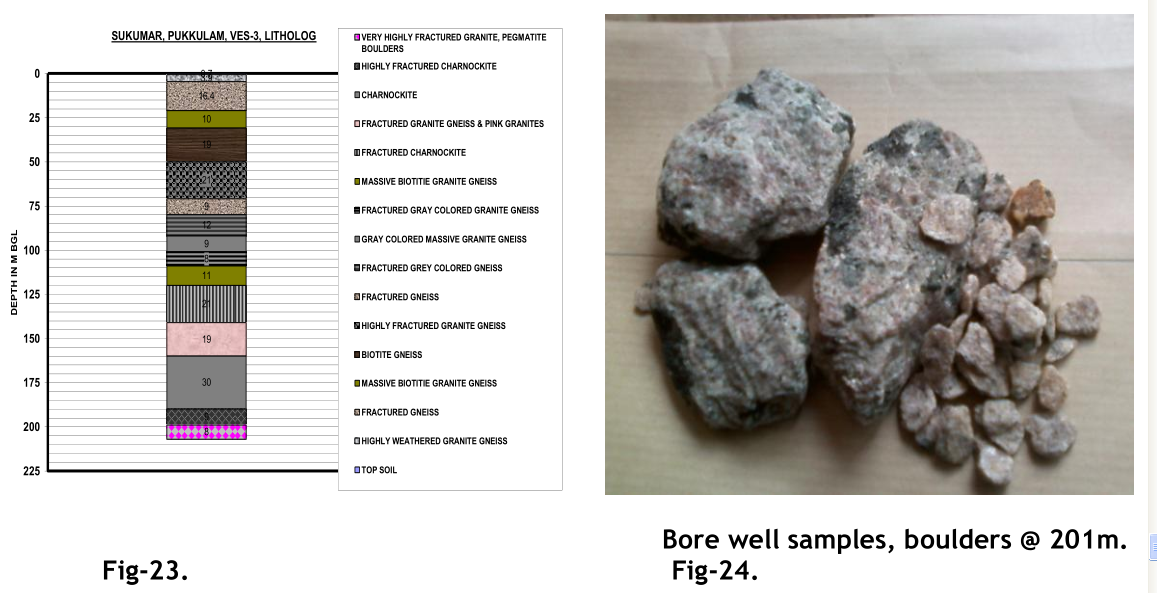
Groundwater prospecting in crystalline rock terrain that too in a drought prone rain shadow region is a challenging task to the hydrogeologist. This research paper pertains to the ground water exploration at Pukkulam in Udumalpet taluk, Tiruppur district, Tamil Nadu for an agriculturist. Due to repeated droughts and depletion of ground water, the existing three bore wells drilled in 1999, 2000 and 2001 each to a depth of 170, 183 and 300 m which were yielding 460, 400 and 500 LPM respectively, ultimately got dried up in 2012. To overcome the crisis, an intensive systematic integrated geoelectrical investigation has been carried out using 1D resistivity technique with Resistivity/IP Meter (Model:WDJD-4). Measurement parameter of WDJD-4 model include Self potential, induced polarization and apparent resistivity.The Vertical Electrical Soundings was conducted adopting Schlumberger array. Different geoelectrical parameters including SP, IP, resistivity, conductance and current flow have been studied integratedly to delineate the deep lineament. The geoelectrical data have been interpreted and analyzed by Surfer and IPI2 Win software. A deep bore well of 163mm dia at VES-3 has been drilled to a depth of 204 m has yielded 276 LPM, where at the depth of 201m, 20 to 40 mm size granite, pegmatite and pink granite boulders have been encountered. Thus the crisis has been overcome by an integrated geoelectrical approach using such a high resolution resistivity imaging system.
Key words: 1D resistivity technique, geoelectrical parameters, induced polarization pegmatites.
INTRODUCTION
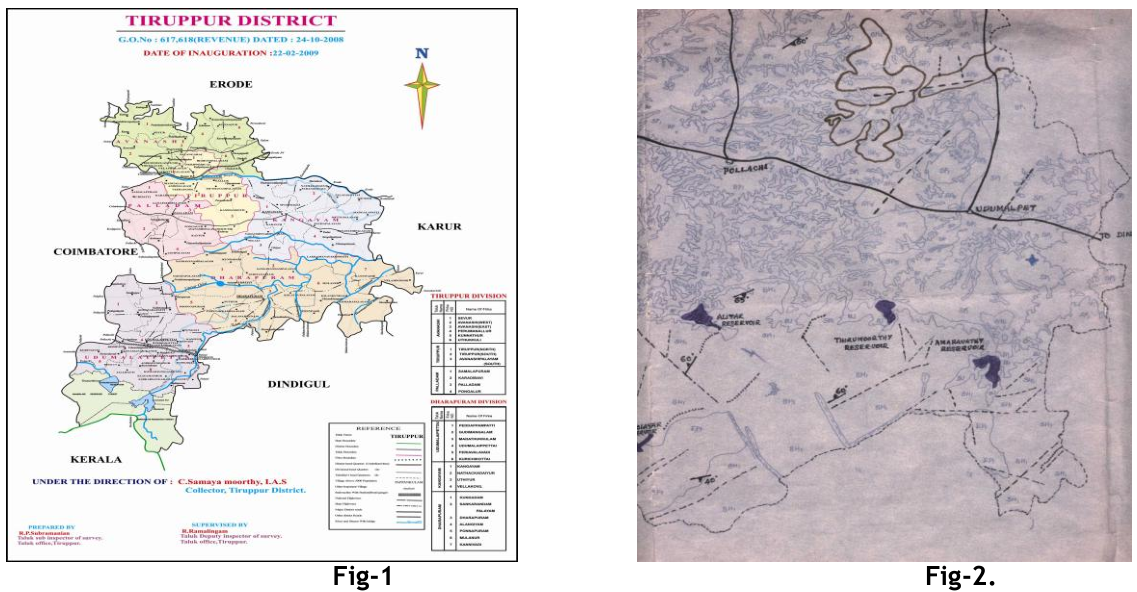
Ground water is the best viable resource for agriculture in acute adverse seasons. The study area Pukkulam village in Gudimangalam Union of Udumalpet taluk of Tiruppur district, Tamil Nadu is about 5 km North West of Udumalpet on Udumalpet- Senjeri hills highway [Fig-1]. The areal extent of agricultural land is about 25 acres, lies on north latitudes 10o 37’ 50.5’’ to 10o 38’ 00.7’’ and east longitudes 77o 13’ 51.8’’ to 77o 14’ 08.0’’. The topography of the area is slightly undulating with a maximum altitude of 1179’ in the North West and minimum altitude of 1164’ in the south east. There are three 163mm dia bore wells and one open well. Out of the three bore wells the very deep bore well [1000’] in the south west corner is poorly yielding and the other two are unyielding. Objective of the study
To pinpoint a ground water potential pocket to drill a deep bore hole for agricultural purpose using different geoelectrical parameters with a high resolution resistivty meter.
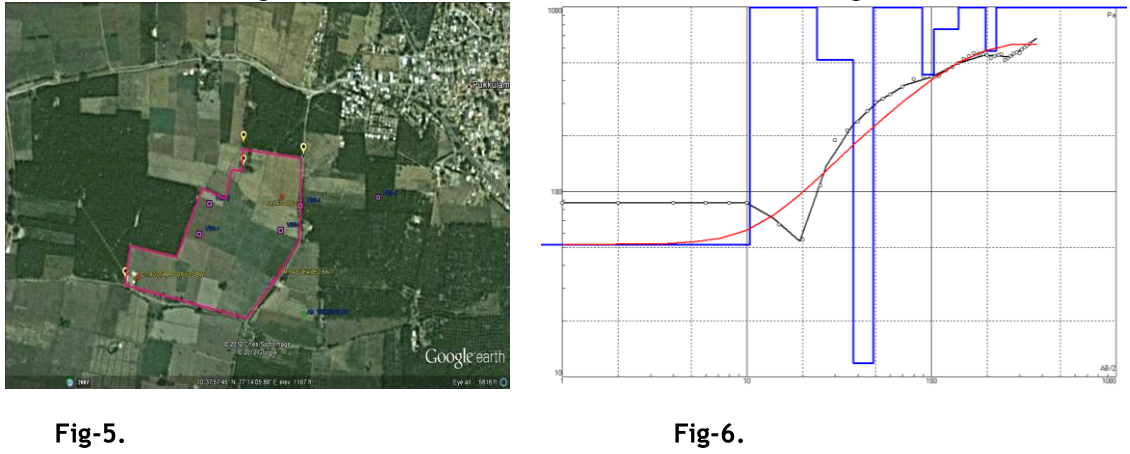
Geological and Hydrogeological setting: The study area is a crystalline rock terrain covered by the Peninsular gneissic complex of Archean age to the Recent formations of soil and kankar. The major rock types are biotite gneiss, granite gneiss, granite and charnockite. The general regional strike of foliation is north east – south west with a dip towards south east. The country rocks are intruded by pegmatites and quartz veins. The degree of weathering is moderate to good. Horizontal fracture systems are well developed [Fig-3]. Kankar is exposed in the northern parts. Both reddish brown and black cotton soils cover the area. The area falls in Parambikulam-Aliyar sub basin. Ground water occurs mainly under unconfined conditions in the weathered zone, joints, and deep fractures. The ground water recharge depends mainly on precipitation. The area is affected by frequent droughts, due to monsoon failures. The pre monsoon water levels were during 07/2001- 30m, 09/2004- 150m and in 2010- 96m below ground level.[6 & 7].
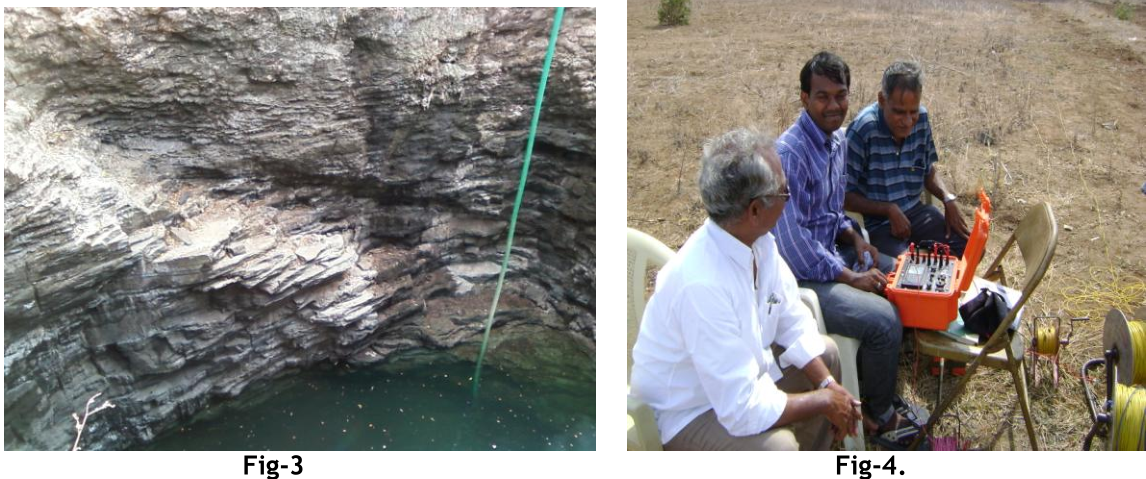
Structure and tectonics: Udumalpet taluk forms a highly tectonized belt and hence structures are complex. Pukkulam area is a tectonically disturbed and highly sheared. The general regional strike is north east- south west with a south east dip. The ground water movement and potential are controlled by the geological structures. Lineament analysis for ground water exploration has considerable importance as the joints and fractures serve as conduits for movement and storage of ground water. Lineaments are the surface manifestations of structurally controlled features such as fault, dykes, joints and vegetation alignments [9]. A major lineament extending from east of Pukkulam, passing through Pottayampalayam, Venasapatti, Poolankinar and Sadayagoundenpudur in the west [Fig-2]. The trend of lineament is north north east- south south west with an extension of about 6 to 7 kms [2]. A minor plunging anticlinal structure is also observed in the central part of village. The drag folds and folded structures indicate a highly tectonized belt. Presence of deep seated fractures below 130 m confirms that the area is highly sheared and shattered again reflecting the tectonic activity. The area of extent influenced by the major structural deformation is very intensive [4].
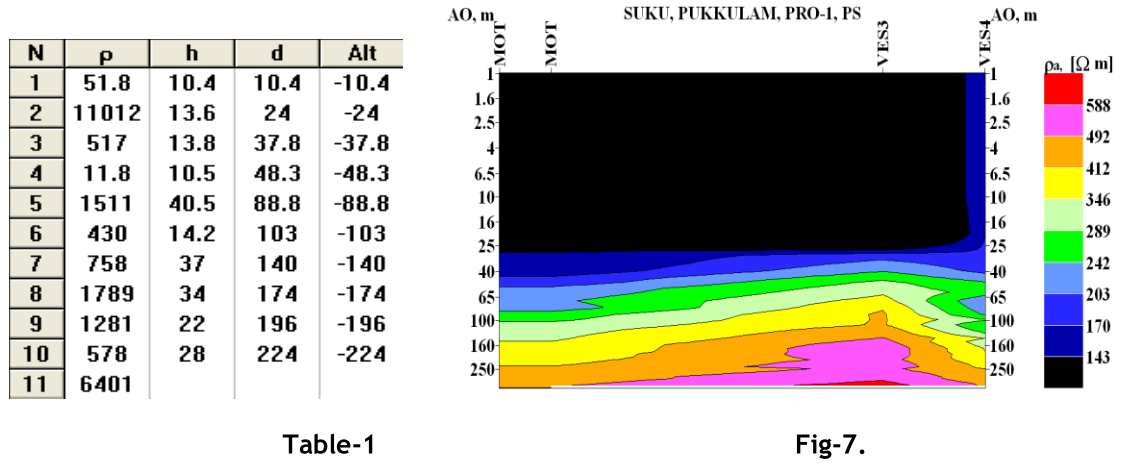
Geoelectrical investigation: The most widely adopted and effective field technique for ground water studies is electrical field. The purpose of geoelectrical investigation is to determine the subsurface resistivity distribution by making measurements on the ground surface by transmitting electric current into the ground through current electrodes and measuring the potential difference through potential electrodes and there by resistance and apparent resistivity can be measured. For this geoelectrical investigation WDJD-4 resistivity/IP meter, multi function digital DC resistivity / IP meter was used. It features multiple functions, high accuracy, fast speed, high reliability and excellent expandability. It has mass data storage up to 1 GB capacity, enabling to store 5,000,000 groups measuring data including current, voltage, SP, Pa, IP etc with USB port to transfer the data to computer.
Data Acquisition: 1D Self potential, Induced polarization and vertical electrical soundings have been carried out using WDJD-4 2D ERT system adopting Schlumberger array [Fig-4]. The maximum AB/2 separation is 340 m. SP, IP and Pa data have been acquired. All these data along with voltage, current stored data have been downloaded to the computer for further analysis.
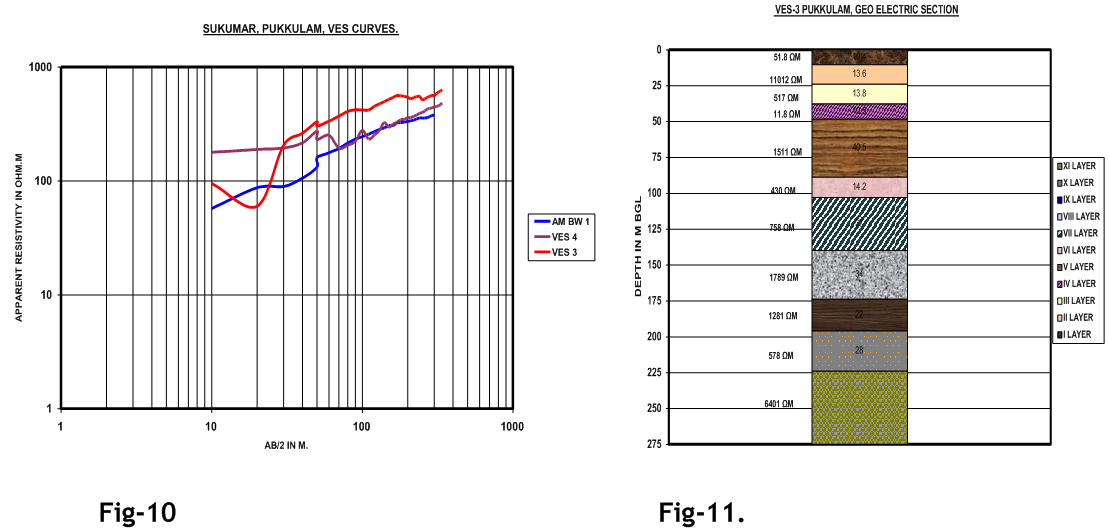
Interpretation of geoelectrical data: The different geoelectrical data thus acquired have been exhibited as graphs, profiles and sections for correlative studies and in depth analysis. The geoelectrical data have been interpreted and analyzed by IPII2 WIN 1D soft ware package version 3.0 and VES curves, geoelectrical profiles of both pseudo and resistivity sections and conductance window for the profile along Mot BW, VES-3 & VES-4 have been generated. IP time domain profiles have been prepared to study the chargeability behavior. Current flow versus depth graph for VES 3 has been prepared. Iso potentials, iso conductance and iso current flow maps for different depths have been generated using Surfer software package version 6.0.
Geoelectrical parameters: The fundamental parameters to describe a geoelectric section are its resistivity ρ and its thickness h. In multilayered cases the individual resistivities and thickness of the geoelectric layers are represented by ρ1 and h1 respectively [table- 1]. From these fundamental parameters other secondary geoelectric parameters namely longitudinal conductance [S] and transverse resistance [T] and anisotropy [λ] are derived. The S and T are also called ‘Dar Zarrouk’ parameters [3].
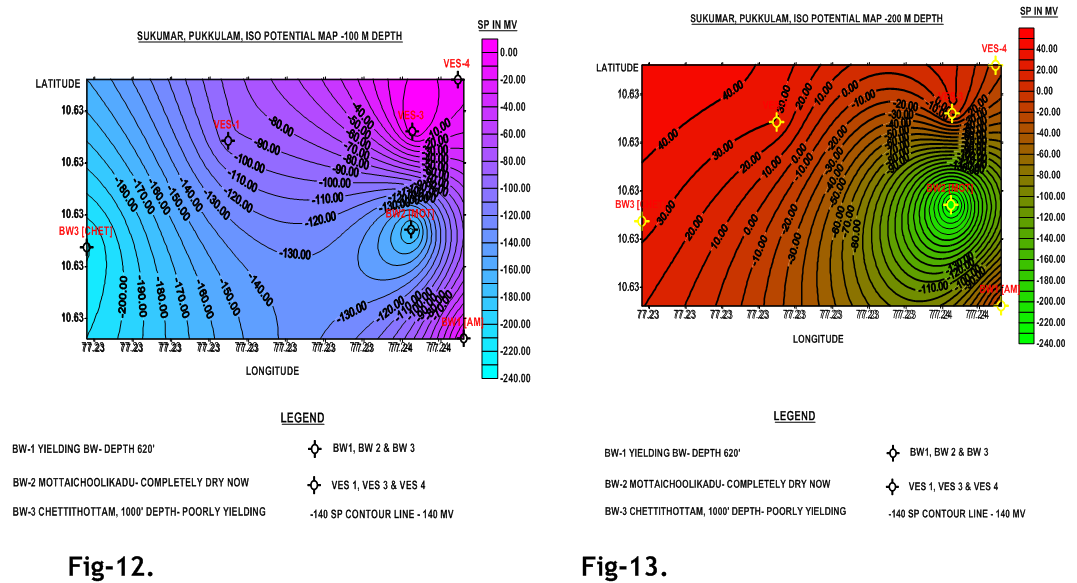
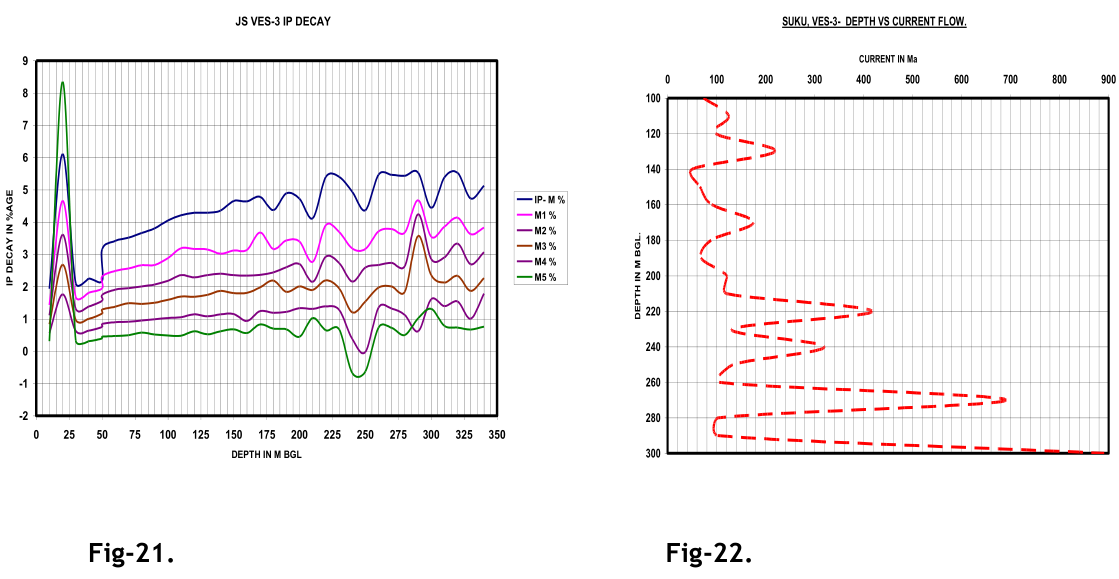
The SP measurements may possibly throw light on movement of ground water and IP technique manifestation of resistivity measurements in time or frequency domain may be of help in identifying separately the formations carrying water and those having clay predomination. IP measurements are made by introducing electrical current into the ground between two current electrodes and making measurements of the induced voltages between two receiver dipoles. A change in IP- the ability of material in the ground to polarize at interface, affects the shape or timing of the received wave form. The IP survey measures apparent chargeability in time domain [8]. The SP and IP measurements have been taken using porous pots. Iso potential maps for 100, 200 and 300 m depth have been generated [Figures-12, 13 &14]. The IP time domains have been exhibited as profiles. [Fig-21].
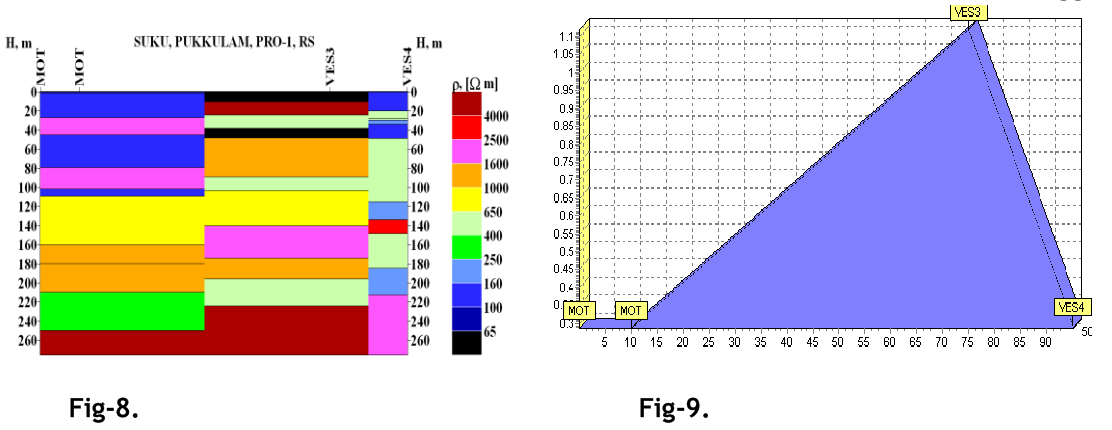
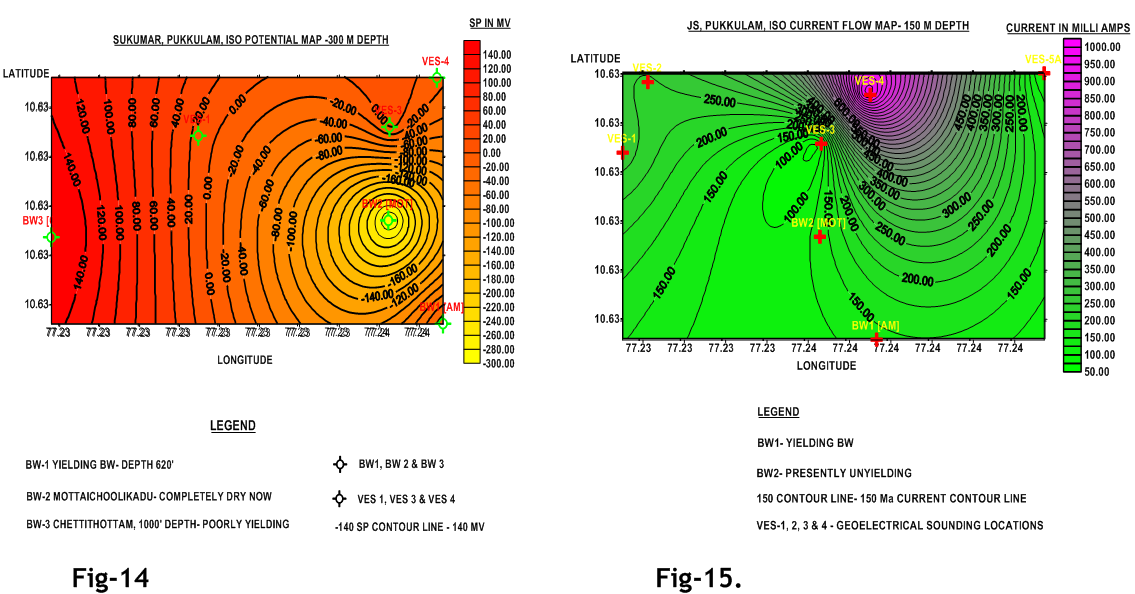
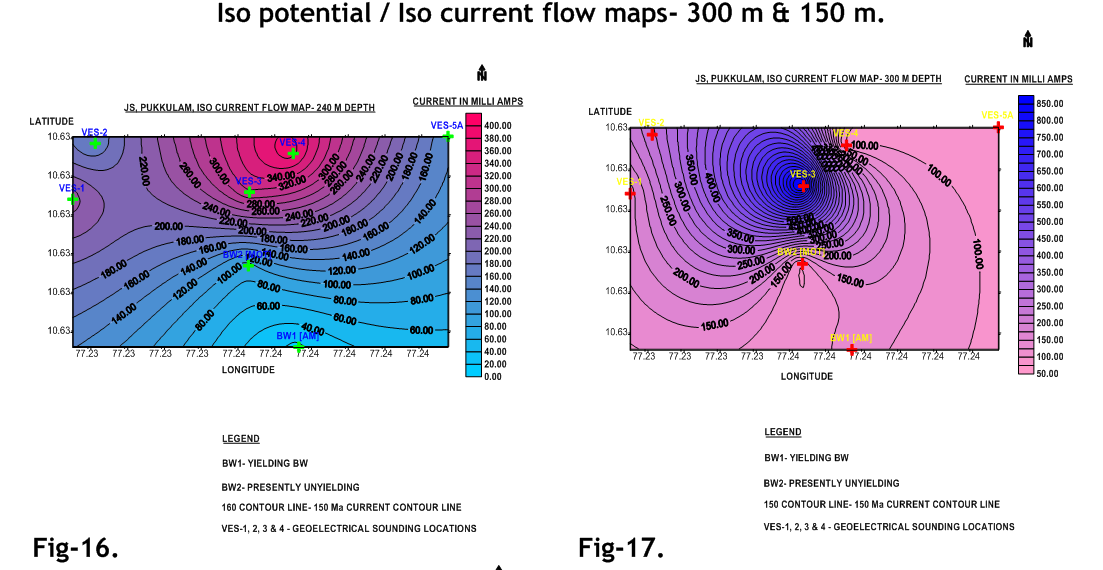
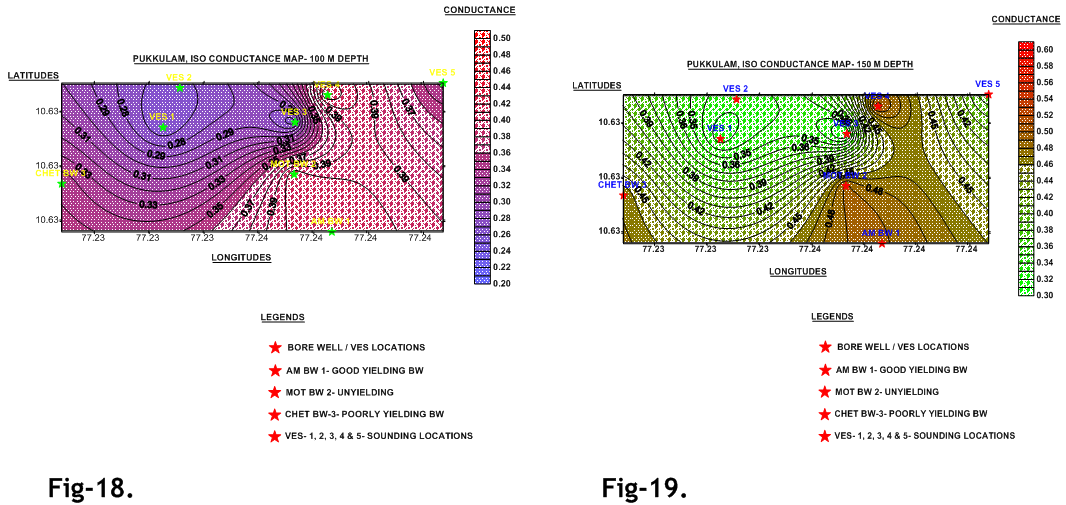
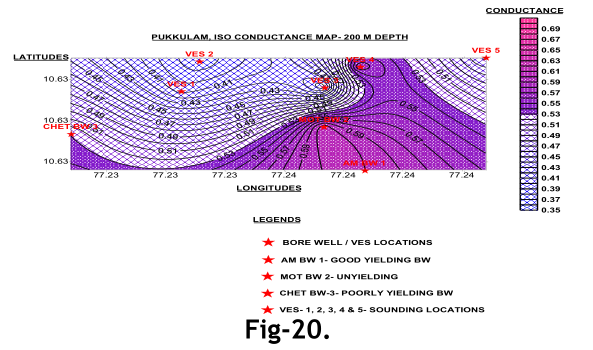
The geoelectric profile along Mot BW2, VES3 & VES4 has been shown as pseudo and resistivity sections. The conductance window for the same profile has been prepared [Fig-9] where in VES 3 has the maximum peak conductance. VES 3 curve is an AA type curve with 11 layered geoelectric earth [Fig- 6]. The geoelectric section for VES 3 has been shown in Fig-11. Current flow contour maps have been prepared for the depths of 150, 240 and 300 m [Figures-15, 16 &17]. Iso conductance maps for the depths of 100, 150 and 200 m have been generated [Figures-18, 19 &20]. The longitudinal conductance [S] values have been obtained by dividing AB/2 by ρa.
Based on the hydrogeological conditions and geoelectrical investigation findings, VES3 has been recommended for drilling a bore hole of 163mm dia up to 300 m engaging DTH rig. The bore well was drilled @ VES3 up to a depth of 204 m only as big boulders and high yield of 276 LPM were encountered at a depth of 201 m.
RESULT AND DISCUSSION
VES 3 is a 11 layered geoelectric earth. Prominent low potential anomalies of -10 to - 20 MV have been exhibited in all the depths of 100, 200 & 300m at VES3, 4 and BW1 AM, may be indicative of saturated fractures. High negative potential anomalies are prominent @ BW3, BW2 and VES1 in all the three contour maps. In the current flow contour maps for the depths of 150, 240 and 300 m, prominent high anomalies have been displayed at VES3 and VES 4, indicating a high conductive water saturated zone. In the iso conductance map for the depths of 100, 150 and 200 m, prominent high conductance anomaly is observed at VES 4. The low conductance anomaly displayed at VES 3 may be attributable to granitic formations having higher reistivities than VES 4. A bore well of 163 mm dia drilled at VES 3 to a depth of 204 m, has yielded 276 LPM [90° V-notch yield- 4’’]. Moisture at 73 m, 11 LPM yield @ 91m and 276 LPM @ 201m bgl were struck respectively. At 201m depth big boulders of biotite granite, pegmatites/ pink granites of 20 to 40mm size have been encountered [Fig- 24], indicating highly sheared and shattered nature of rocks reflecting the presence of deep lineament. There are two prominent low true resistivity anomalies at the depths of 89 and 196m in the geoelectrical section of VES3 [Fig-11]. 11 and 276 LPM of yields have been struck @ the depths of 91 & 201 m which very well coincide with the anomalous zones of geoelectric section. In current flow profile of VES 3 [Fig-22], a prominent high anomaly is reflected @ the depth range of 200 to 240 m and a very potential aquifer has been struck @ the depth of 201m. The high current anomaly may be attributed to this potential yield and because of high saturation of water the current consumption is high.
Conclusion and sum up:
VES 3 is AA type curve with 11 layered geoelectric section. The minimum and maximum true resistivites of VES3 geoelectric section are 11.8 and 11,012 Ωm respectively. Low negative SP anomalies are prominent in VES 3, may be attributable to the saturated fractures. The high current flow anomalies are very prominent in VES 3 indicating water saturated aquifers which have been confirmed by the high potential yield at 201 m. The big boulders encountered at the depth of 201 m bgl with a high yield of 276 LPM crystal clearly confirms the presence of deep lineament and this area is tectonically disturbed. The ground water potential and movement are primarily governed by these geological structures in this area. If this deep seated fractures/ lineaments are traced by proper ground water exploration techniques, the failure rates can be considerably minimized. Thus by analyzing different geoelectrical parameters, the deep potential aquifers could be identified successfully.
 ENGLISH
 Chinese
 Russian

